Analyzing Real-Time Audio with the Soundscape Widget
March 15, 2026
Unlocking the World of Sound with the Soundscape Widget
In the Internet of Things (IoT), data comes in many forms. We are accustomed to tracking temperature, humidity, location, and vibration. But one of the most information-rich, yet often overlooked, sources of data is all around us: sound. From the subtle hum of a healthy industrial motor to the disruptive noise of urban traffic, understanding the soundscape provides invaluable insights. Our Soundscape Widget, a core component of the MQTTfy dashboard, is a powerful tool designed to demystify audio data, transforming invisible sound waves into intuitive, real-time visualizations directly on your IoT dashboard.
This guide will explore the world of real-time audio analysis, from the fundamental science of sound to the practical architecture of building an audio-monitoring system using IoT devices and the MQTT protocol. We will show you how the Soundscape Widget turns complex audio signals into actionable business intelligence.
Why Visualize a Soundscape? The Business Case for Machine Listening
A "soundscape" is the total acoustic environment of an area, and "machine listening" is the science of teaching computers to understand it. Analyzing a soundscape is not just about measuring volume; it's about identifying the unique sonic fingerprint of an environment or a process. This has profound applications across numerous industries.
- Predictive Maintenance: In the world of Industrial IoT (IIoT), unexpected downtime is the enemy. By constantly listening to machinery, you can detect subtle changes in sound that predict failures long before they happen. A new whine, a slight rumble, or a high-pitched hiss can be the first sign of bearing wear, gear-tooth damage, or a compressed air leak.
- Environmental Monitoring: Authorities can track urban noise pollution in real-time to enforce regulations. Conservationists can study wildlife by identifying and counting bird or animal calls in remote locations, providing non-invasive data on biodiversity.
- Manufacturing Quality Control: For many products, the sound they make is a key indicator of their quality. An IoT device on an assembly line can listen to the "click" of a switch, the "snap" of a closing lid, or the "hum" of a small motor. If the sound deviates from the "golden standard," the product can be flagged for inspection automatically.
- Security and Safety: An audio monitoring system can detect the sound of breaking glass, smoke alarms, or calls for help, triggering immediate alerts. In industrial settings, it can identify the sound of a gas leak or a structural failure.
- Smart Cities & Buildings: Audio sensors can be used to detect traffic flow patterns, identify vehicle collisions for faster emergency response, or even control HVAC systems in a building based on occupancy levels detected through ambient noise.
The Soundscape Widget on your MQTTfy dashboard presents this complex information in a way that is easy to understand, allowing operators and managers to make faster, better-informed decisions.
From Sound Wave to Spectrogram: A Technical Deep Dive
To appreciate how the Soundscape widget works, it's important to understand the journey of sound from a physical wave to a digital visualization.
- The Sound Wave: Sound is a pressure wave traveling through a medium like air. A microphone acts as a transducer, converting this physical pressure wave into an analog electrical signal.
- Sampling (Analog-to-Digital Conversion): An IoT device cannot process an analog signal directly. It uses an Analog-to-Digital Converter (ADC) to measure, or "sample," the voltage of the signal thousands of times per second. The number of samples per second is the sampling rate, measured in Hertz (Hz). According to the Nyquist-Shannon sampling theorem, the sampling rate must be at least twice the highest frequency you wish to capture. For human speech, a sampling rate of 8000 Hz (8 kHz) is often sufficient, while CD-quality audio uses 44,100 Hz (44.1 kHz) to capture the full range of human hearing up to 20 kHz. The bit depth of the ADC determines the dynamic range, or the precision of each sample. A 16-bit ADC provides 65,536 distinct steps to represent the wave's amplitude, offering a wide dynamic range suitable for most applications.
- The Fast Fourier Transform (FFT): While the waveform shows us the loudness of a sound over time, it doesn't tell us much about its character. To find out, we need to analyze its frequency components. The Fast Fourier Transform (FFT) is a highly efficient algorithm that acts like a prism for sound. It takes a chunk of waveform data (a "window") and deconstructs it into the various frequencies that make it up, showing the amplitude of each one. The output of an FFT is what we call a spectrum. To improve the accuracy of the FFT, a windowing function (like a Hann or Hamming window) is applied to the audio chunk before the transform. This smooths the edges of the data, reducing spectral leakage and resulting in a cleaner, more accurate frequency analysis.
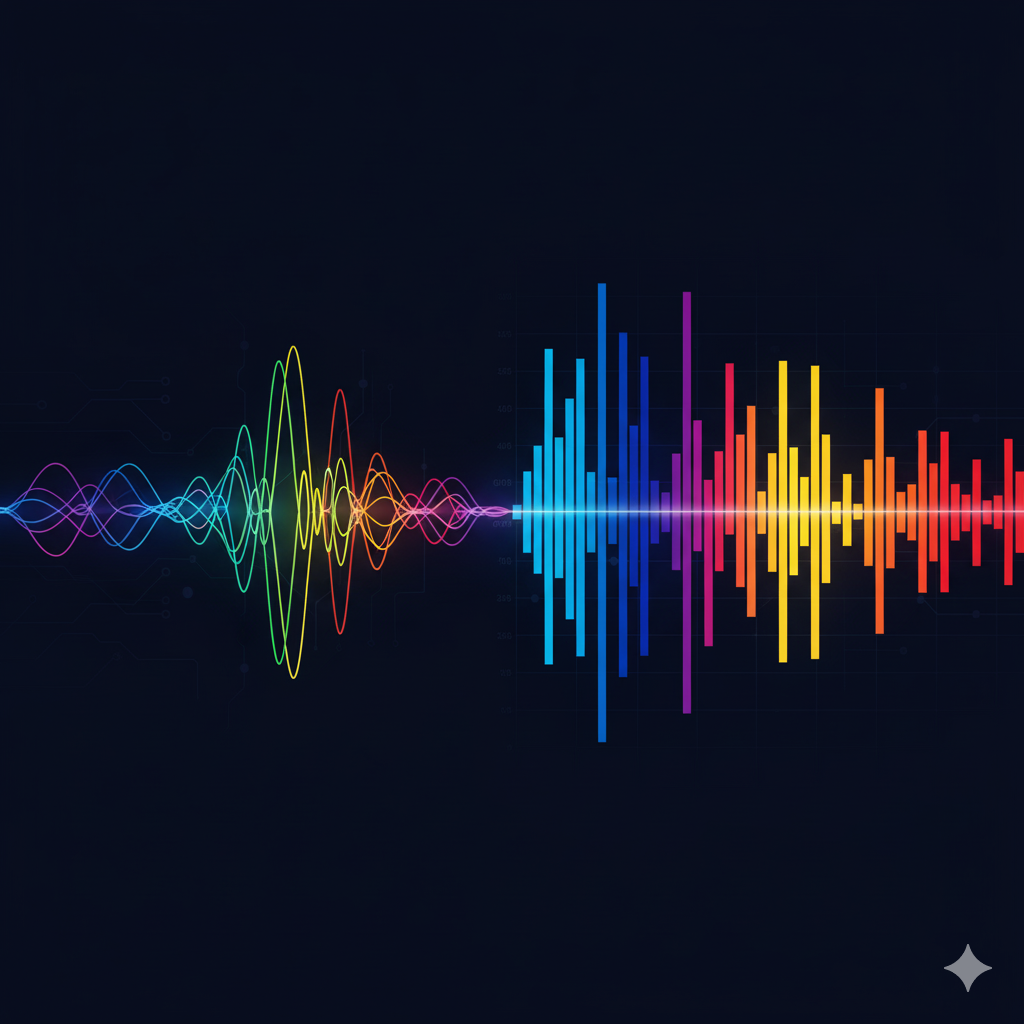
The Soundscape Widget uses this exact process. The Waveform Line shows the raw amplitude data over time, while the Frequency Bars show the spectrum—the output of the FFT—giving you a complete picture of the sound.
Advanced Audio Analytics at the Edge with TinyML
For the most advanced applications, like true predictive maintenance, even a real-time FFT isn't enough. You need to move beyond simple analysis and into the realm of machine learning at the edge, or TinyML. Instead of just seeing the data, you can teach the device to understand it.
The Concept: You can train a small neural network to recognize specific sound events. The model learns the sonic signature of a "normal" machine state and can then identify any deviation as a potential "anomaly."
The Workflow:
- Data Collection: Capture audio samples from your target machine during normal operation and during various known failure modes (if possible).
- Feature Extraction: Instead of feeding raw audio to the model, you extract features. For audio, the most powerful features are often Mel-Frequency Cepstral Coefficients (MFCCs). MFCCs are a representation of the short-term power spectrum of a sound, based on a linear cosine transform of a log power spectrum on a nonlinear mel scale of frequency. This sounds complex, but in essence, they model how the human ear perceives sound, making them extremely effective for recognizing audio events.
- Model Training: In a cloud environment, use a framework like TensorFlow to train a small neural network (a classifier) on the extracted MFCCs. You label your data so the model learns to differentiate between "normal," "bearing_wear," "unbalanced_load," etc.
- Deployment to the Edge: Convert the trained model into a highly efficient format using a tool like TensorFlow Lite for Microcontrollers. This creates a tiny model file that can be deployed directly onto a powerful microcontroller like an ESP32-S3.
- Inference and Publication: The edge device now runs a continuous loop: capture a second of audio -> compute the MFCCs -> feed them into the local ML model -> get a prediction. Now, instead of sending raw data, the device publishes a highly meaningful, single MQTT message to your Synapse MQTT broker:
{"status": "anomaly_detected", "confidence": 0.92}. An alert on your MQTTfy dashboard can then be triggered based on this simple, high-value message.
This TinyML approach represents the pinnacle of efficient IoT architecture, maximizing insight while minimizing bandwidth and power consumption.
Choosing the Right Hardware for Your Audio Project
The quality of your audio analysis begins with the quality of your hardware.
- Microphones:
- Electret Condenser Microphones (ECMs): These are the most common and affordable type. They are analog devices and require an amplifier circuit to boost the signal to a level a microcontroller can read. Modules like the MAX9814 are excellent because they include an amplifier with automatic gain control (AGC), which adjusts the sensitivity based on how loud the sound is.
- MEMS Microphones: Micro-Electro-Mechanical Systems microphones are tiny silicon chips that are extremely durable and consistent. They are the standard in modern smartphones. They often come with digital interfaces like I2S (Inter-IC Sound) or PDM (Pulse-Density Modulation). Digital microphones like the INMP441 (I2S) are superb for high-fidelity applications as they are less susceptible to electrical noise than analog mics.
- Microcontrollers and Processors:
- ESP32: This is the workhorse of the IoT world. Its dual-core processor, ample RAM, and built-in Wi-Fi make it powerful enough to sample audio, perform a real-time FFT, and publish the results via MQTT. Its I2S peripheral makes it easy to interface with digital microphones.
- Raspberry Pi Pico (RP2040): A very low-cost but surprisingly powerful microcontroller. Its unique Programmable I/O (PIO) feature is excellent for handling non-standard audio protocols, but its lower RAM makes it more suited for simpler analysis like dB calculation rather than complex FFT or ML.
- Single-Board Computers (SBCs): A device like a Raspberry Pi 4 or 5 runs a full Linux OS. This gives you immense power and flexibility to write complex analysis code in Python using libraries like SciPy and TensorFlow. SBCs are ideal for edge gateways that might aggregate data from multiple simpler sensors, or for applications where you need to run more complex ML models that won't fit on a microcontroller. The trade-off is higher cost and power consumption.
Building an MQTT-Based Audio Analysis System
While you can use the Soundscape Widget with your browser's microphone, its true power is unlocked when connected to a network of remote IoT devices. Streaming raw audio 24/7 is incredibly bandwidth-intensive and impractical for most IoT applications. A much smarter architecture involves processing the audio at the edge.
This edge-processing architecture is the standard for scalable IoT deployments:
- Capture: An IoT device with a microphone captures a small chunk of audio.
- Process: The microcontroller on the device performs an FFT and analyzes the result locally.
- Extract: Instead of sending the whole audio clip, the device extracts only the key features of interest.
- Publish: The device publishes this small, structured data to a topic on a central MQTT broker.
- Visualize: The Soundscape Widget on your MQTT dashboard is subscribed to that topic and updates its visualization instantly.
Security & Privacy: A Critical Consideration
Audio data is inherently sensitive. The prospect of an always-on microphone in a factory, office, or public space raises legitimate privacy concerns. A properly designed audio analysis system must be secure and privacy-preserving by default.
- Edge Processing as a Privacy Feature: This is the most important concept. The architectural pattern of processing audio on the device and transmitting only anonymized metadata (like a dB level, a frequency, or an "anomaly detected" alert) is a powerful privacy tool. The raw, potentially sensitive audio never leaves the device and is never stored, effectively eliminating the risk of eavesdropping.
- Securing the Data Channel: For the metadata that is transmitted, you must secure the channel using the full suite of MQTT security features. This is a core part of securing your IoT devices. This includes:
- Encryption: Always use TLS/SSL (MQTTS) to encrypt all data in transit between the device and your MQTT broker.
- Authentication: Ensure that only authorized devices can connect to your broker. This is best accomplished using unique X.509 client certificates for each device.
- Authorization: Use Access Control Lists (ACLs) on the broker to enforce the principle of least privilege. A sensor in one location should only be able to publish to its own designated topic and should not be able to subscribe to or publish to any others.
Platforms like MQTTfy are built with these principles in mind, simplifying the complex task of managing a secure and private IoT deployment.
How to Configure the Soundscape Widget
Use Case 1: Real-Time Microphone Analysis (Local)
This is the simplest way to get started. Set the Data Source Type to Bluetooth in the widget settings and grant your browser permission to use the microphone.
Use Case 2: Monitoring a Decibel Level via MQTT (Remote Sensor)
This provides a clear, at-a-glance view of a machine's loudness. Add the "Audio Spectrum" widget, set the Data Source Type to MQTT, and enter your Broker details and the specific Topic your device is publishing the dB level to.
Use Case 3: Advanced Predictive Maintenance with JSON Payload
Let's evolve the previous use case. The same IoT device is now programmed to perform an FFT and publish a detailed JSON payload to factory/floor1/machine3/diagnostics. On our MQTTfy dashboard, we can build a much richer diagnostic view:
- Soundscape Widget: Add a Soundscape widget subscribed to the
db_levelfield within the JSON payload to show the overall noise. - Gauge Widget: Add a Gauge widget subscribed to the
peak_freqfield to see the dominant frequency. - Indicator Widget: Add an Indicator light widget subscribed to
bearing_wear_indicator. Configure it to turn red when the value exceeds a threshold.
This is the power of a flexible IoT dashboard.
Conclusion: From Noise to Knowledge
The Soundscape Widget transforms raw, invisible audio waves into actionable visual insights. It moves beyond simple data points, adding a rich, new dimension to your IoT monitoring systems. By combining intelligent edge processing with the efficiency of the MQTT protocol, you can build highly scalable, secure, and insightful audio analysis solutions for any application.