Case Study: Aquaculture Monitoring
May 20, 2024
Modern aquaculture, or fish farming, relies on maintaining precise water quality to ensure the health and growth of its stock. Manual water testing is labor-intensive and provides only infrequent snapshots. By deploying IoT sensors and visualizing the data with ioCtrlMQ, fish farm operators can achieve continuous, real-time monitoring and react quickly to changing conditions.

The Challenge
An inland tilapia farm needs to monitor several large tanks. The most critical parameters are water temperature, pH level, and Dissolved Oxygen (DO) concentration. Sudden changes in these parameters, especially a drop in DO, can be fatal to the fish stock. The farm manager needs a system that provides constant visibility and alerts them to any dangerous deviations.
The Solution with ioCtrlMQ
Each fish tank is equipped with a sensor probe that measures temperature, pH, and DO. These sensors are connected to a microcontroller with a cellular or Wi-Fi module that publishes the data to an MQTT broker every five minutes. Topics are structured logically, for example: farm/tank-01/temperature, farm/tank-01/ph, farm/tank-01/do.
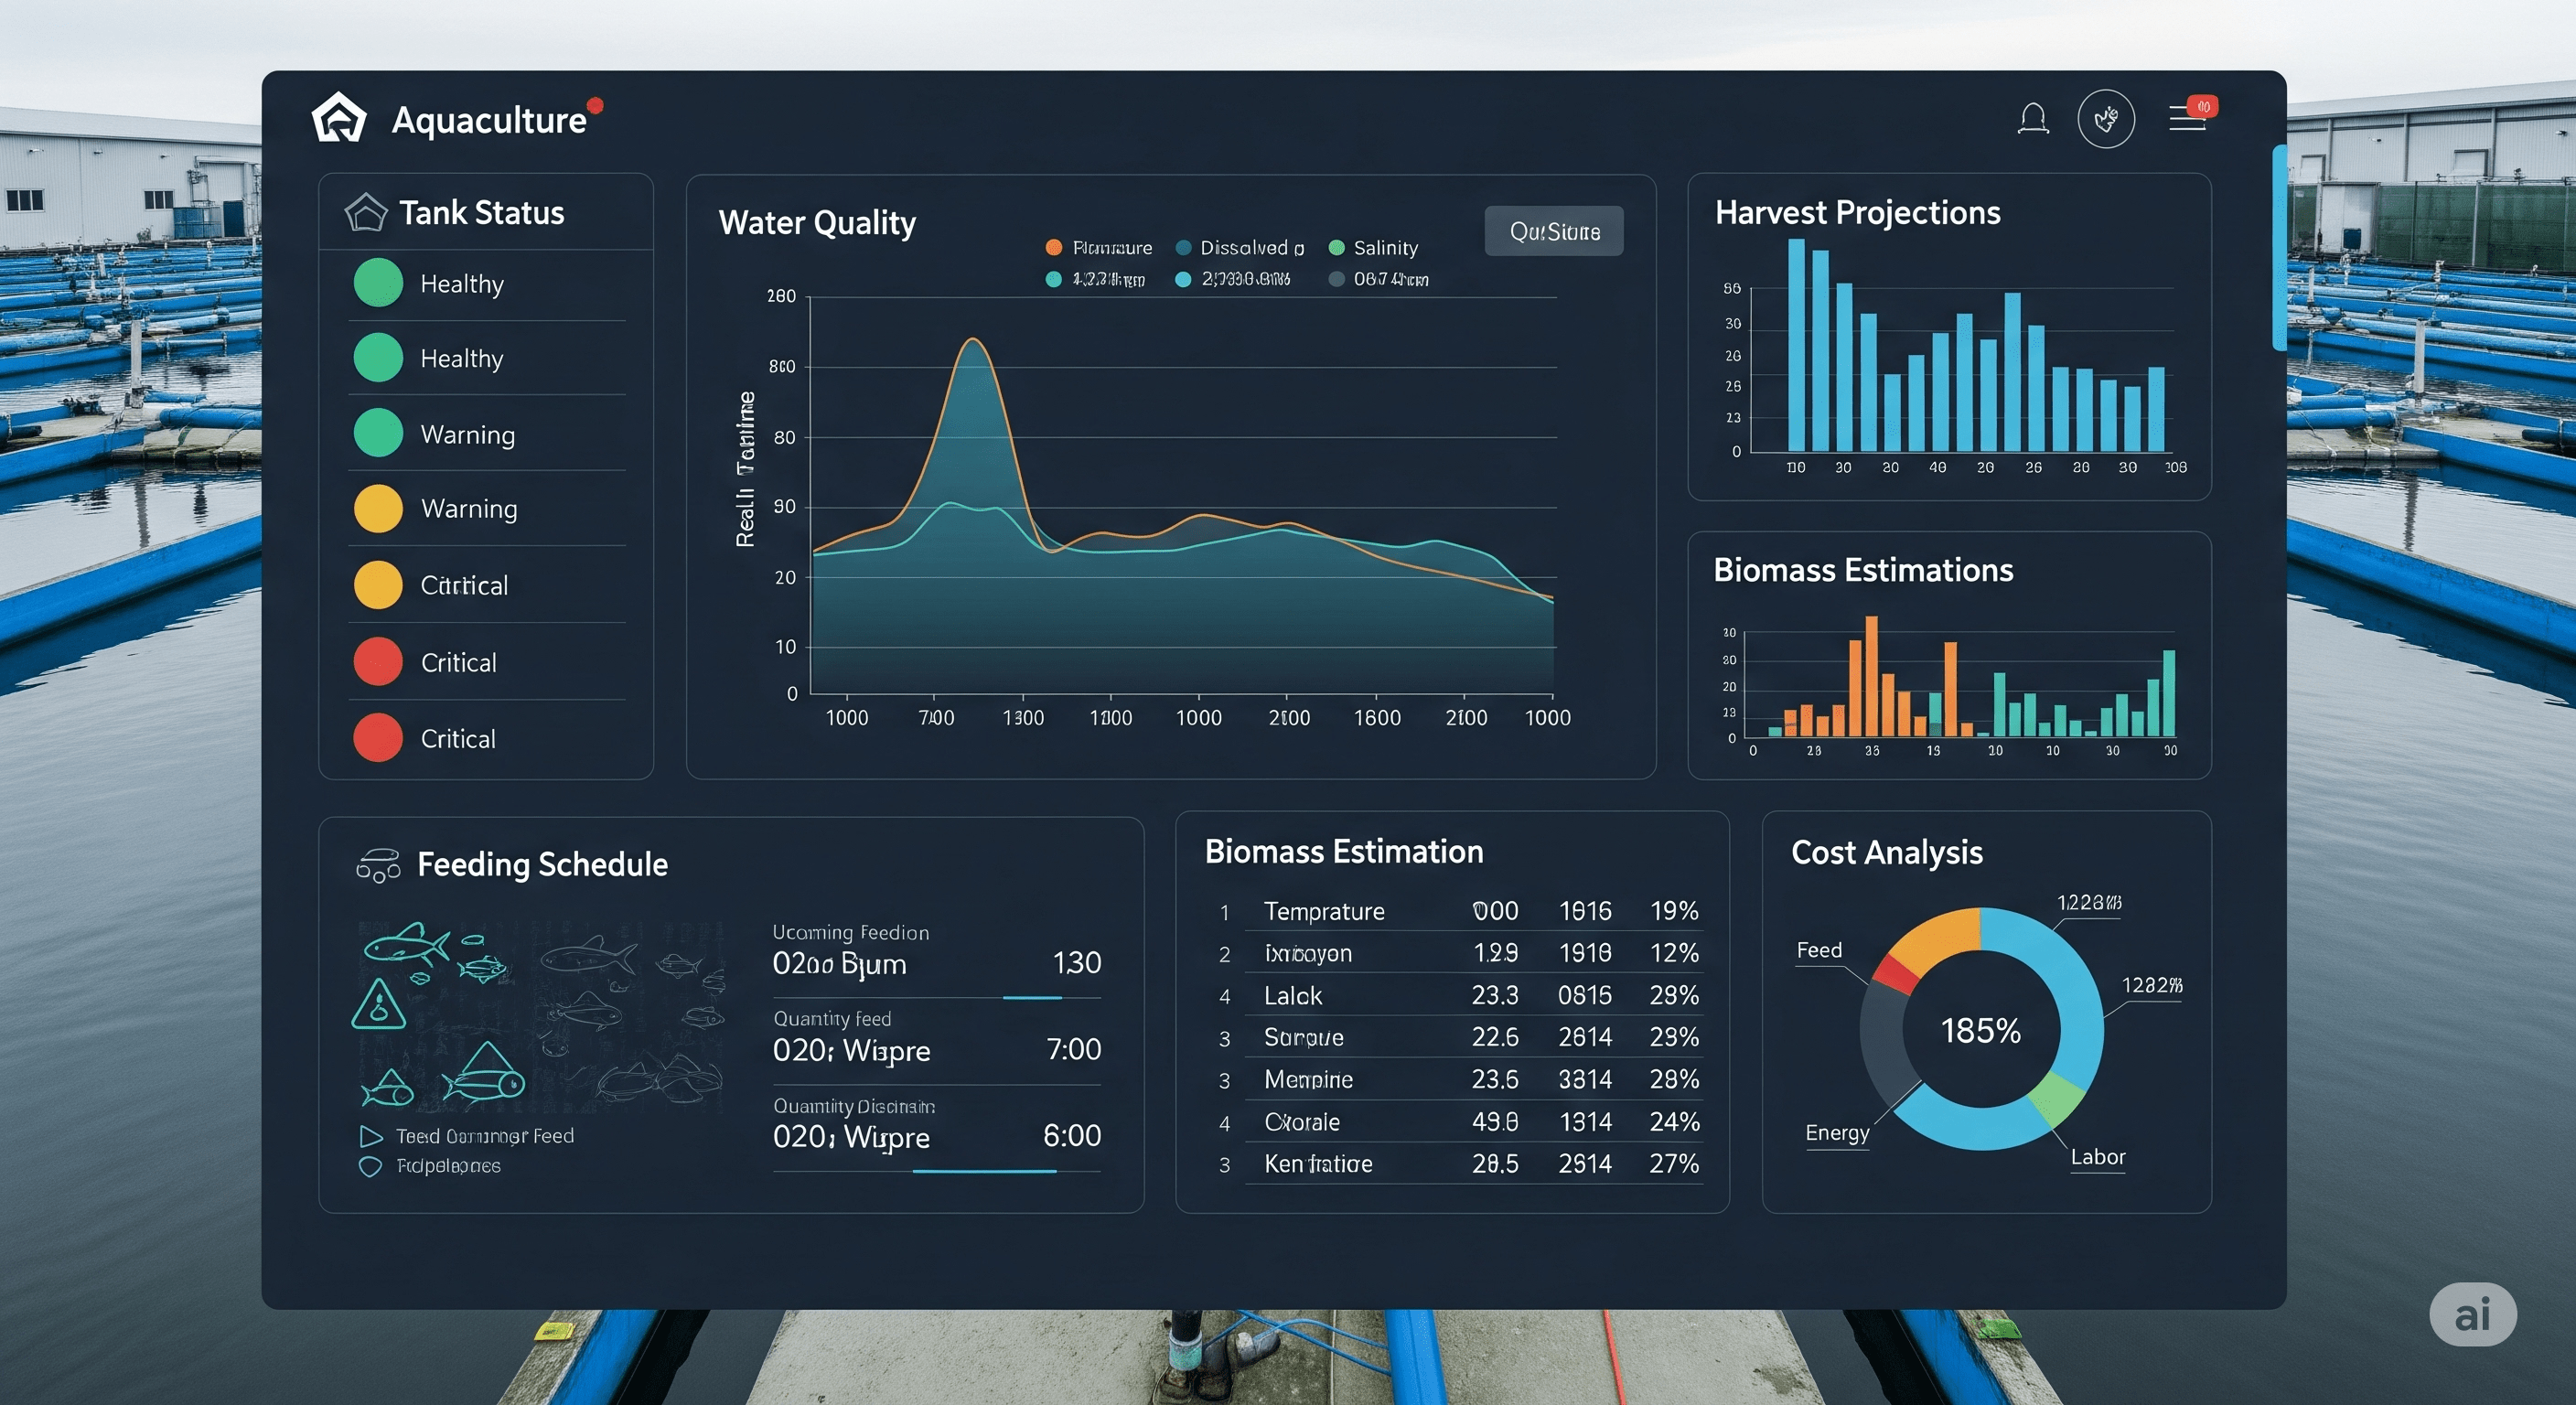
An ioCtrlMQ dashboard is created to serve as the central control room:
- Multi-Gauge Panel: A Multi-Gauge widget is configured with a gauge for each critical parameter (Temp, pH, DO) for a specific tank. This provides a quick, consolidated view of a single tank's health. The gauges have min/max values set to the ideal range for tilapia.
- Temperature Bars: For a higher-level overview, a Temperature Bar widget is used for each parameter (one for Temp, one for pH, one for DO), with each bar inside the widget representing a different tank. This allows for easy comparison between all tanks.
- Alert Configuration: The most crucial part of the setup. Each gauge and bar has an Alert configured. For example, the Dissolved Oxygen gauge has an alert set to trigger if the value drops below a critical threshold (e.g., 5 mg/L). The alert is configured with a high severity to be immediately noticeable.
- Historical Chart: A Historical Chart widget plots the DO, pH, and temperature for a selected tank over the last 24 hours. This is essential for identifying trends, such as a gradual decrease in oxygen levels overnight.
The Outcome
The ioCtrlMQ dashboard provides the farm manager with complete peace of mind. One night, the dashboard alert for Tank 03's Dissolved Oxygen triggers, turning the gauge bright red. The manager receives the alert and immediately inspects the tank, finding that an aerator pump has malfunctioned. They are able to switch to a backup pump before any fish are lost. The historical chart later confirms the sharp drop and the successful recovery after the intervention, demonstrating the system's value.