Case Study: Energy Management
May 19, 2024
Effective energy management is crucial for both cost savings and sustainability. By visualizing real-time power consumption, building managers and homeowners can identify opportunities to reduce waste, shift usage to off-peak hours, and promote energy-conscious behaviors. ioCtrlMQ is an ideal tool for creating a centralized energy monitoring dashboard.

The Challenge
A facility manager for a mid-sized office building needs to monitor the energy consumption of different floors and major HVAC (Heating, Ventilation, and Air Conditioning) units. The goal is to identify which areas are the biggest consumers and to track the effectiveness of energy-saving initiatives, such as turning off lights and equipment after hours.
The Solution with ioCtrlMQ
Smart meters and power sensors, which communicate via MQTT, are installed on each floor and for each major HVAC unit. These devices publish data such as current power draw (kW), total consumption (kWh), and power factor to specific MQTT topics.
An ioCtrlMQ dashboard is configured to visualize this data:
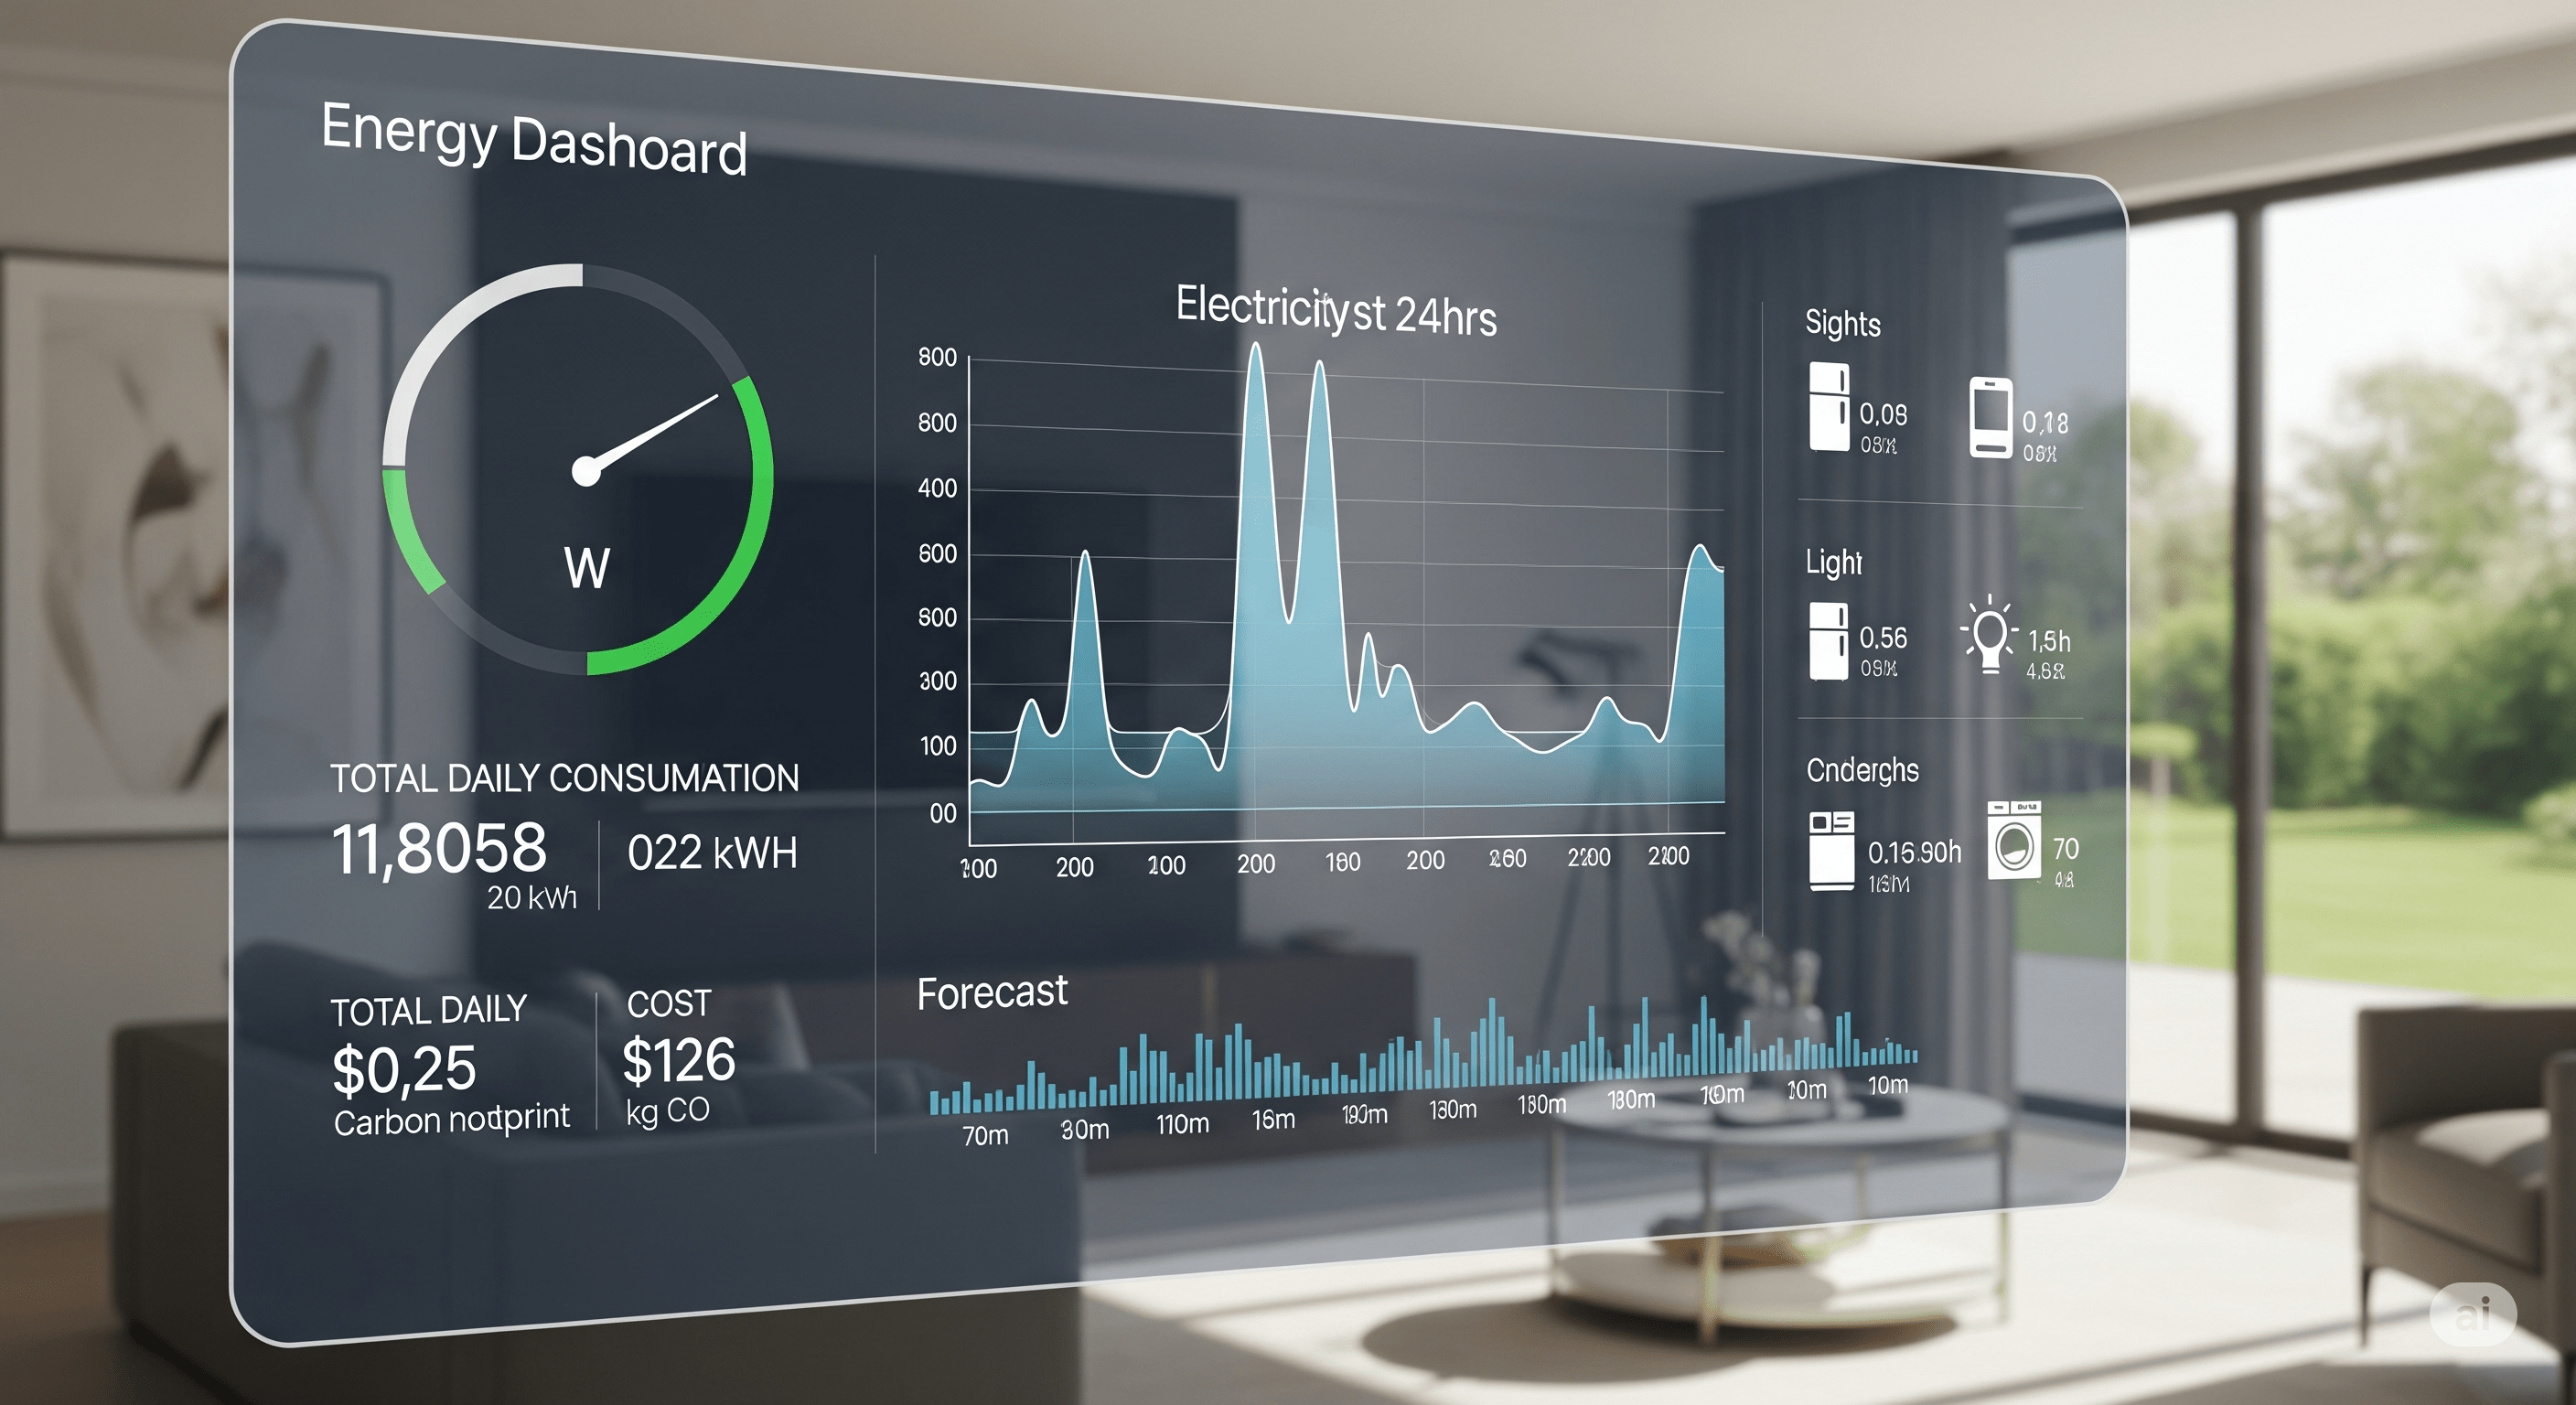
- Dial Gauges: A set of Dial Bar widgets provides an immediate, at-a-glance view of the current power draw for each floor. The dials are configured with a maximum value based on the circuit's capacity, and color-coded alerts are set to trigger if consumption exceeds a predefined "high usage" threshold.
- Historical Chart: A Historical Chart widget tracks the total energy consumption (kWh) for each floor over the course of the day. This is the most critical widget for identifying trends, showing clear peaks during business hours and verifying that consumption drops significantly overnight and on weekends.
- Text Displays: Text Display widgets show the cumulative kWh for the day for the entire building, providing a single, key performance indicator.
- Bar Chart: A Bar Chart widget compares the total daily consumption across all floors, making it easy to see which floor is the highest consumer.
The Outcome
With the ioCtrlMQ dashboard, the facility manager can instantly see the building's energy profile. They quickly identify that the 3rd floor's HVAC unit continues to run at high capacity overnight. By adjusting the schedule, they achieve a 15% reduction in overnight energy consumption. The historical charts provide clear evidence of the savings, justifying the investment in the monitoring system and encouraging further energy-saving behaviors among employees.