Case Study: Environmental Monitoring
May 16, 2024
Environmental monitoring is a critical application for IoT, enabling scientists, communities, and governments to track pollution, weather, and ecosystem health in real-time. An ioCtrlMQ dashboard can be used to create a public-facing portal, making complex environmental data accessible and understandable to everyone.

The Challenge
A local environmental non-profit organization has deployed a network of low-cost air and water quality sensors throughout the city. They are measuring air particulates (PM2.5), temperature, humidity, and water turbidity in a local river. They need a way to visualize this data on a public website to raise awareness and engage the community.
The Solution with ioCtrlMQ
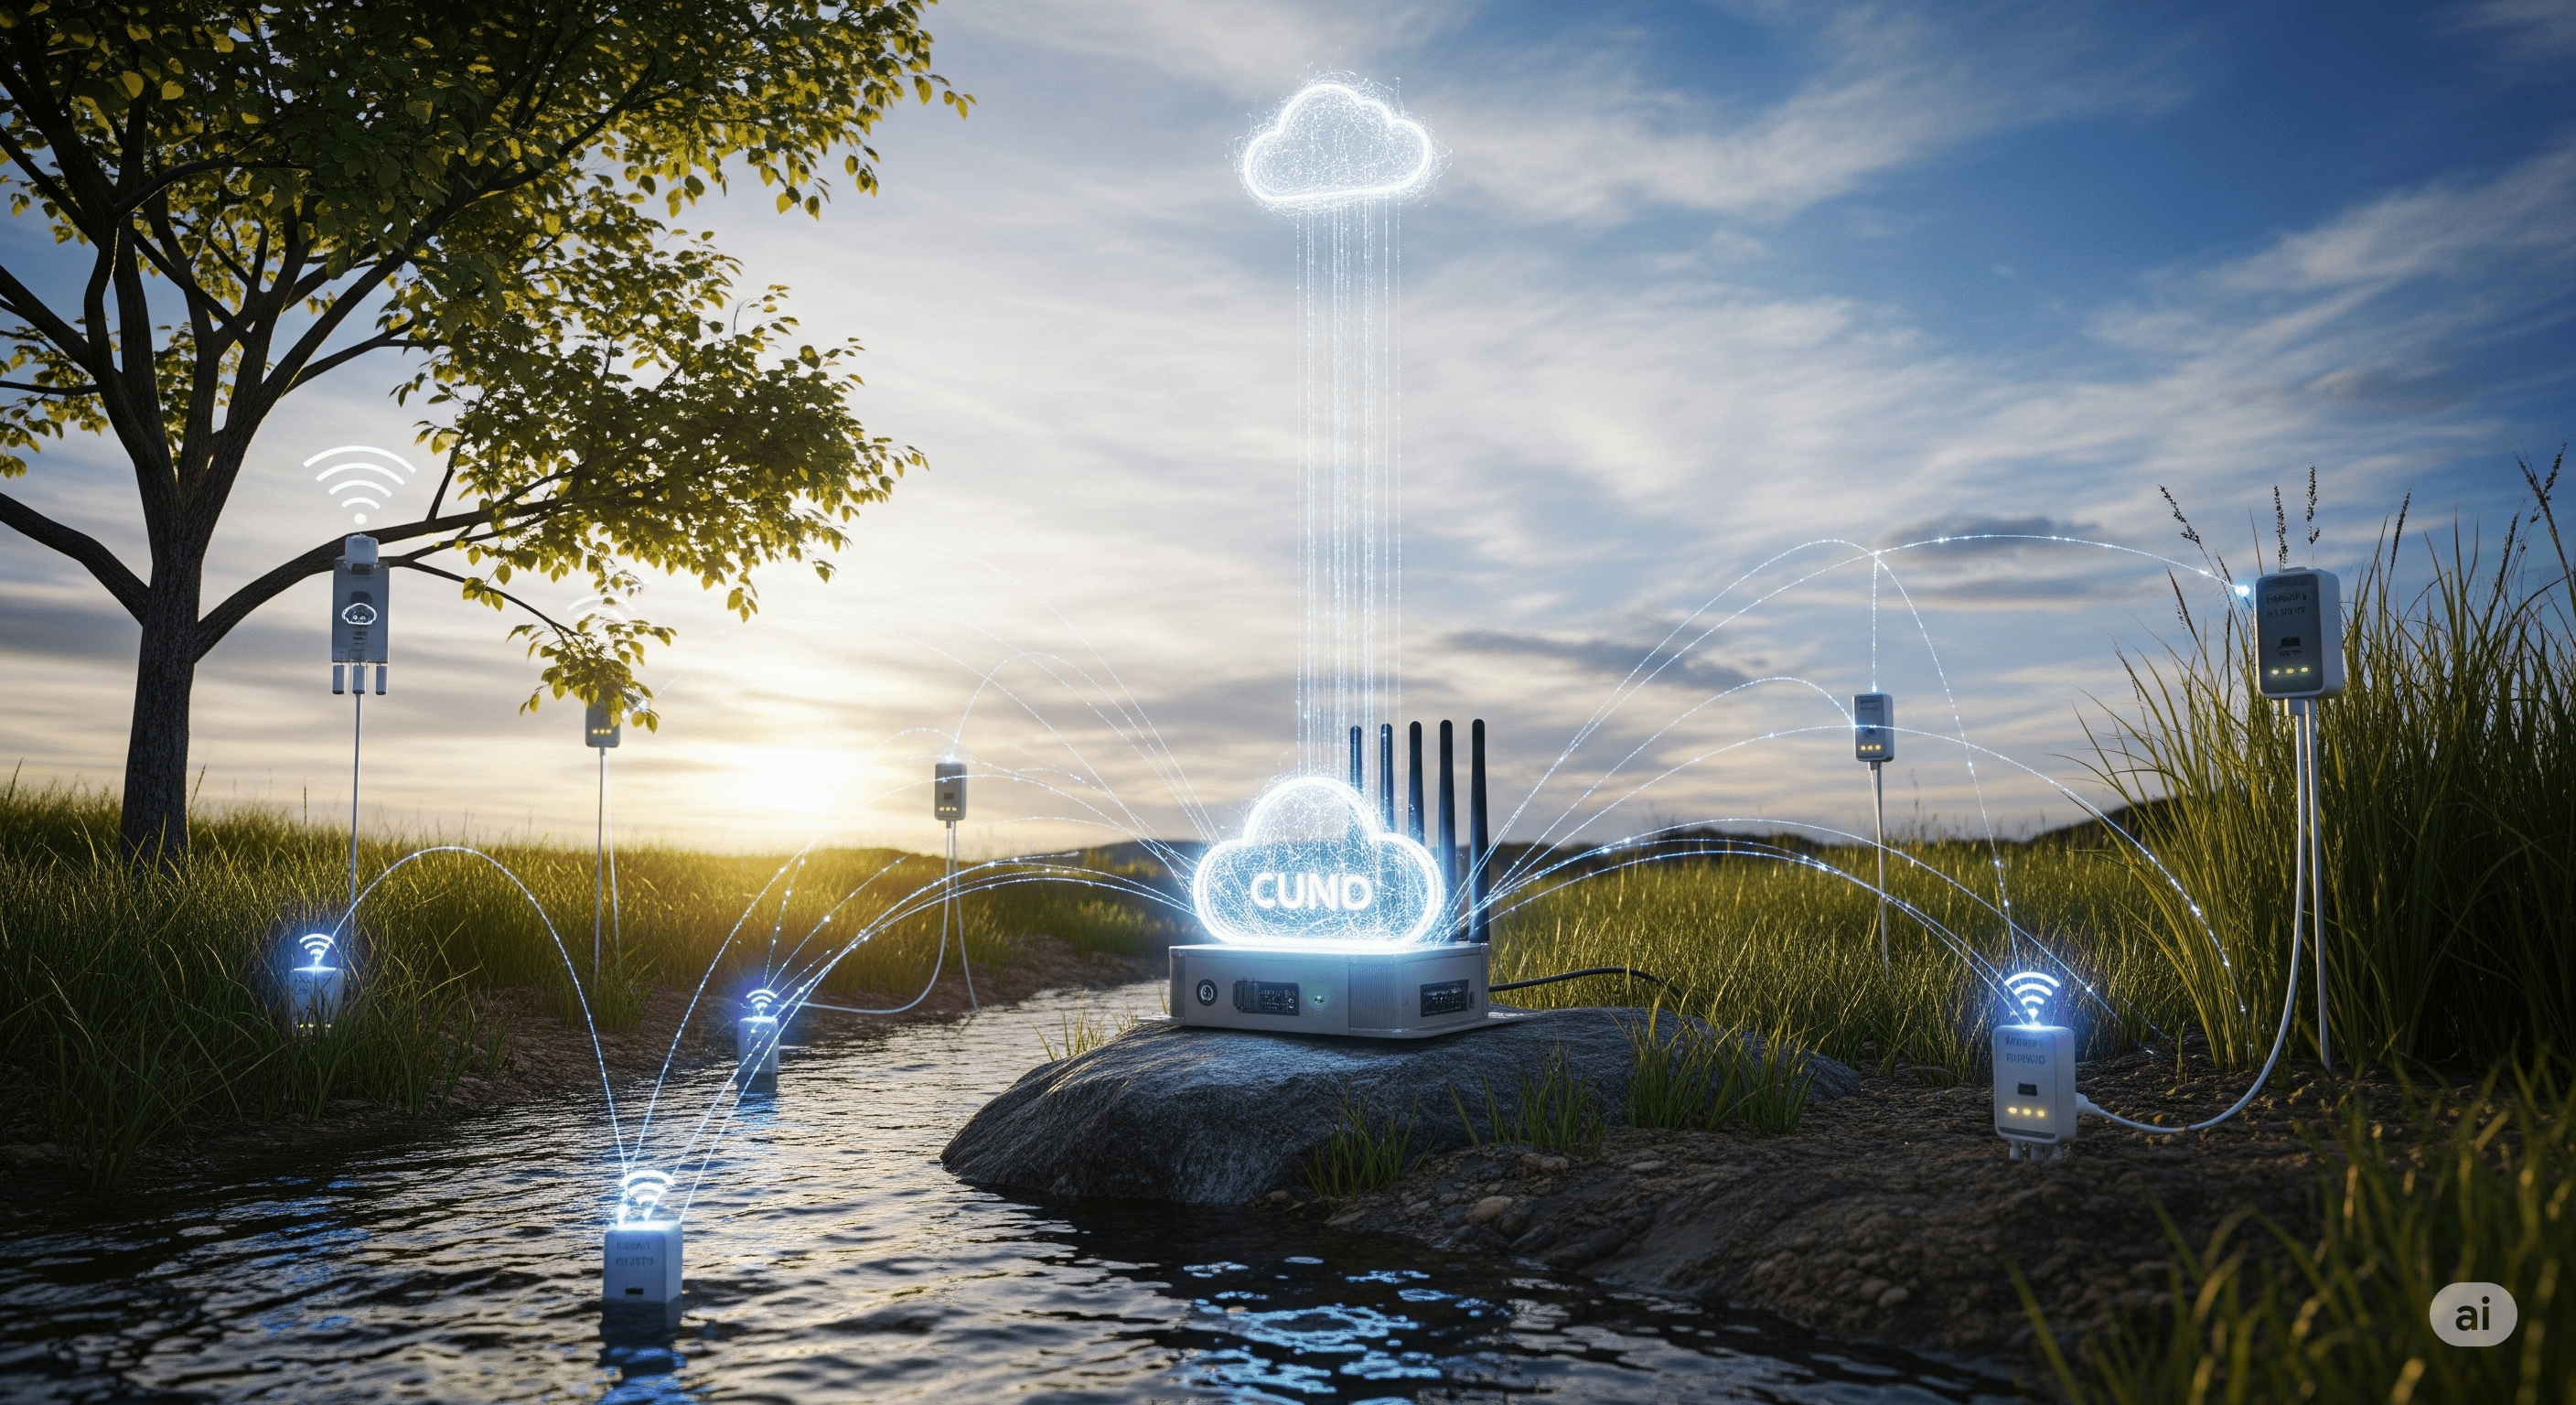
The sensors, equipped with Wi-Fi or cellular connectivity, publish their readings to a public MQTT broker every 15 minutes. Topics are structured by location and measurement type, for example:
city/park-east/air/pm25city/park-east/air/temperaturecity/river-bridge/water/turbidity
The non-profit creates a public ioCtrlMQ dashboard and embeds it on their website using an iframe. The dashboard is designed for clarity and public consumption:
- Map Location Widget: The main feature is a Map Location widget showing the location of each sensor station. The markers are color-coded using a data transformation script based on the Air Quality Index (AQI) calculated from the PM2.5 readings. Green indicates good air quality, yellow is moderate, and red is unhealthy. Clicking a marker on the map opens a popup showing the latest readings for all parameters at that location.
- Temperature Bar Widgets: A set of Temperature Bar widgets are used to show the current temperature and humidity readings from a selected station, providing a familiar and easy-to-understand visual.
- Dial Bar Widget: A Dial Bar widget is used to display the river's water turbidity level. The dial is configured with thresholds for 'Clear', 'Slightly Turbid', and 'Very Turbid' to make the scientific measurement (NTU) understandable to a general audience.
- Historical Chart: A Historical Chart allows users to see the trend of PM2.5 levels over the past 48 hours, which is useful for observing pollution patterns during traffic rush hours or specific weather events.
The Outcome
The public dashboard is a huge success. Local news outlets feature the website, and community engagement increases. Citizens use the dashboard to check air quality before planning outdoor activities. The historical data becomes a valuable resource for local university students studying urban environmental science. The non-profit uses the clear, visual data on the dashboard to successfully advocate for local policies aimed at reducing air pollution, backed by a transparent and publicly accessible dataset.