Case Study: Industrial Machinery Monitoring
May 13, 2024
In a manufacturing environment, machine downtime is extremely costly. Proactively monitoring the health and performance of industrial machinery is key to maximizing uptime and productivity. By connecting Programmable Logic Controller (PLC) data to an ioCtrlMQ dashboard via an MQTT bridge, operators and managers can gain real-time visibility into their factory floor.

The Challenge
A factory producing plastic components needs a centralized way to monitor its fleet of injection molding machines. Key metrics include machine status (running, idle, faulted), cycle time, part count, and mold temperature. This data exists within the machine's PLC but is only accessible on-site via a local HMI (Human-Machine Interface). The plant manager wants a dashboard that can be viewed from their office or on a large screen on the factory floor.
The Solution with ioCtrlMQ
An MQTT gateway is installed on the factory network. This gateway reads the relevant data registers from each machine's PLC (using a protocol like Modbus or OPC-UA) and publishes the data to structured MQTT topics, such as:
factory/molding/machine-01/statusfactory/molding/machine-01/temperaturefactory/molding/machine-01/part_count
An ioCtrlMQ dashboard is then set up to subscribe to these topics:
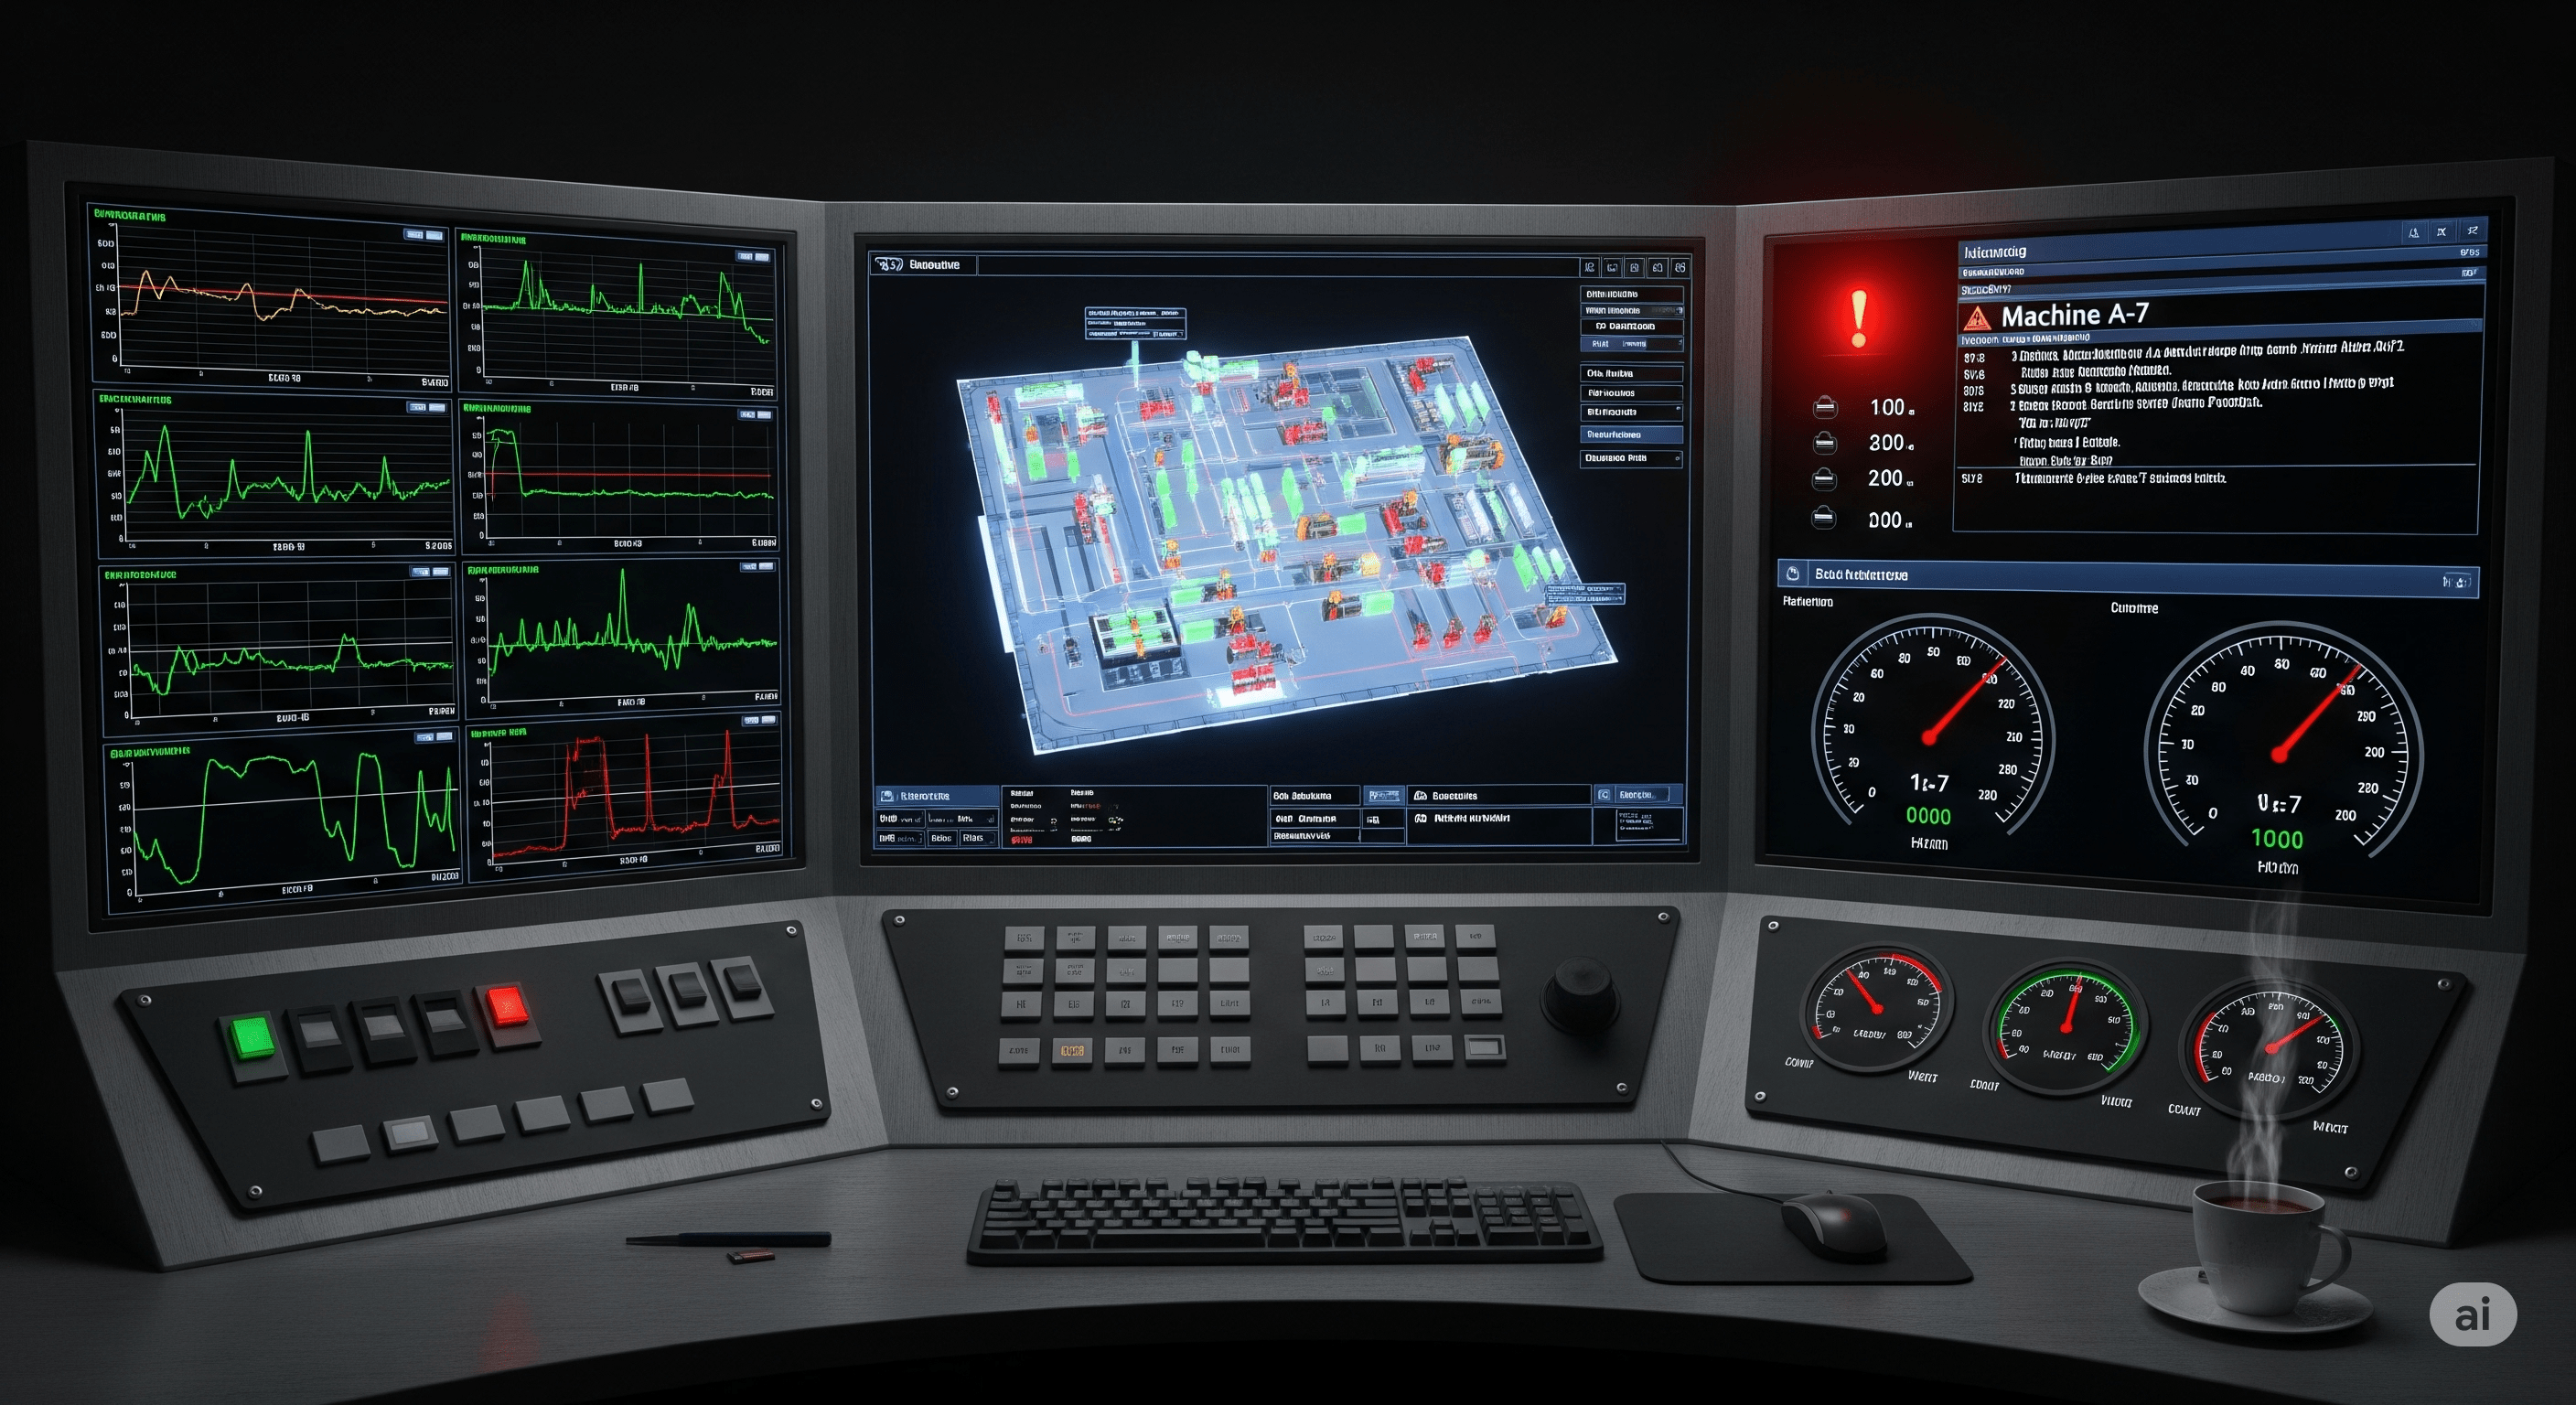
- Multi-LED Panel: A Multi-LED widget is configured to show the status of each machine. The LEDs are green for 'running', yellow for 'idle', and red for 'faulted', providing an instant overview of the entire machine fleet.
- Multi-Gauge Panel: A Multi-Gauge widget displays the current mold temperature for each machine, with alert thresholds configured to warn operators of overheating conditions.
- Text Displays: A series of Text Display widgets show the live part count for each machine, giving a clear indication of production output.
- Line Chart: A Line Chart widget plots the cycle time for a specific machine over the last hour. Spikes in the chart can indicate potential mechanical or material-flow issues that need investigation.
The Outcome
The dashboard becomes the central information hub for the molding department. The plant manager can see at a glance which machines are productive and which are facing issues. When a machine faults, the red LED on the dashboard immediately alerts the maintenance team, who can react faster. By analyzing the cycle time chart, operators identify a machine that is gradually slowing down. A proactive maintenance check reveals a worn-out hydraulic component, which is replaced during scheduled downtime, preventing a costly unplanned stop.