Case Study: Building a Smart City with IoT and MQTT
February 22, 2026
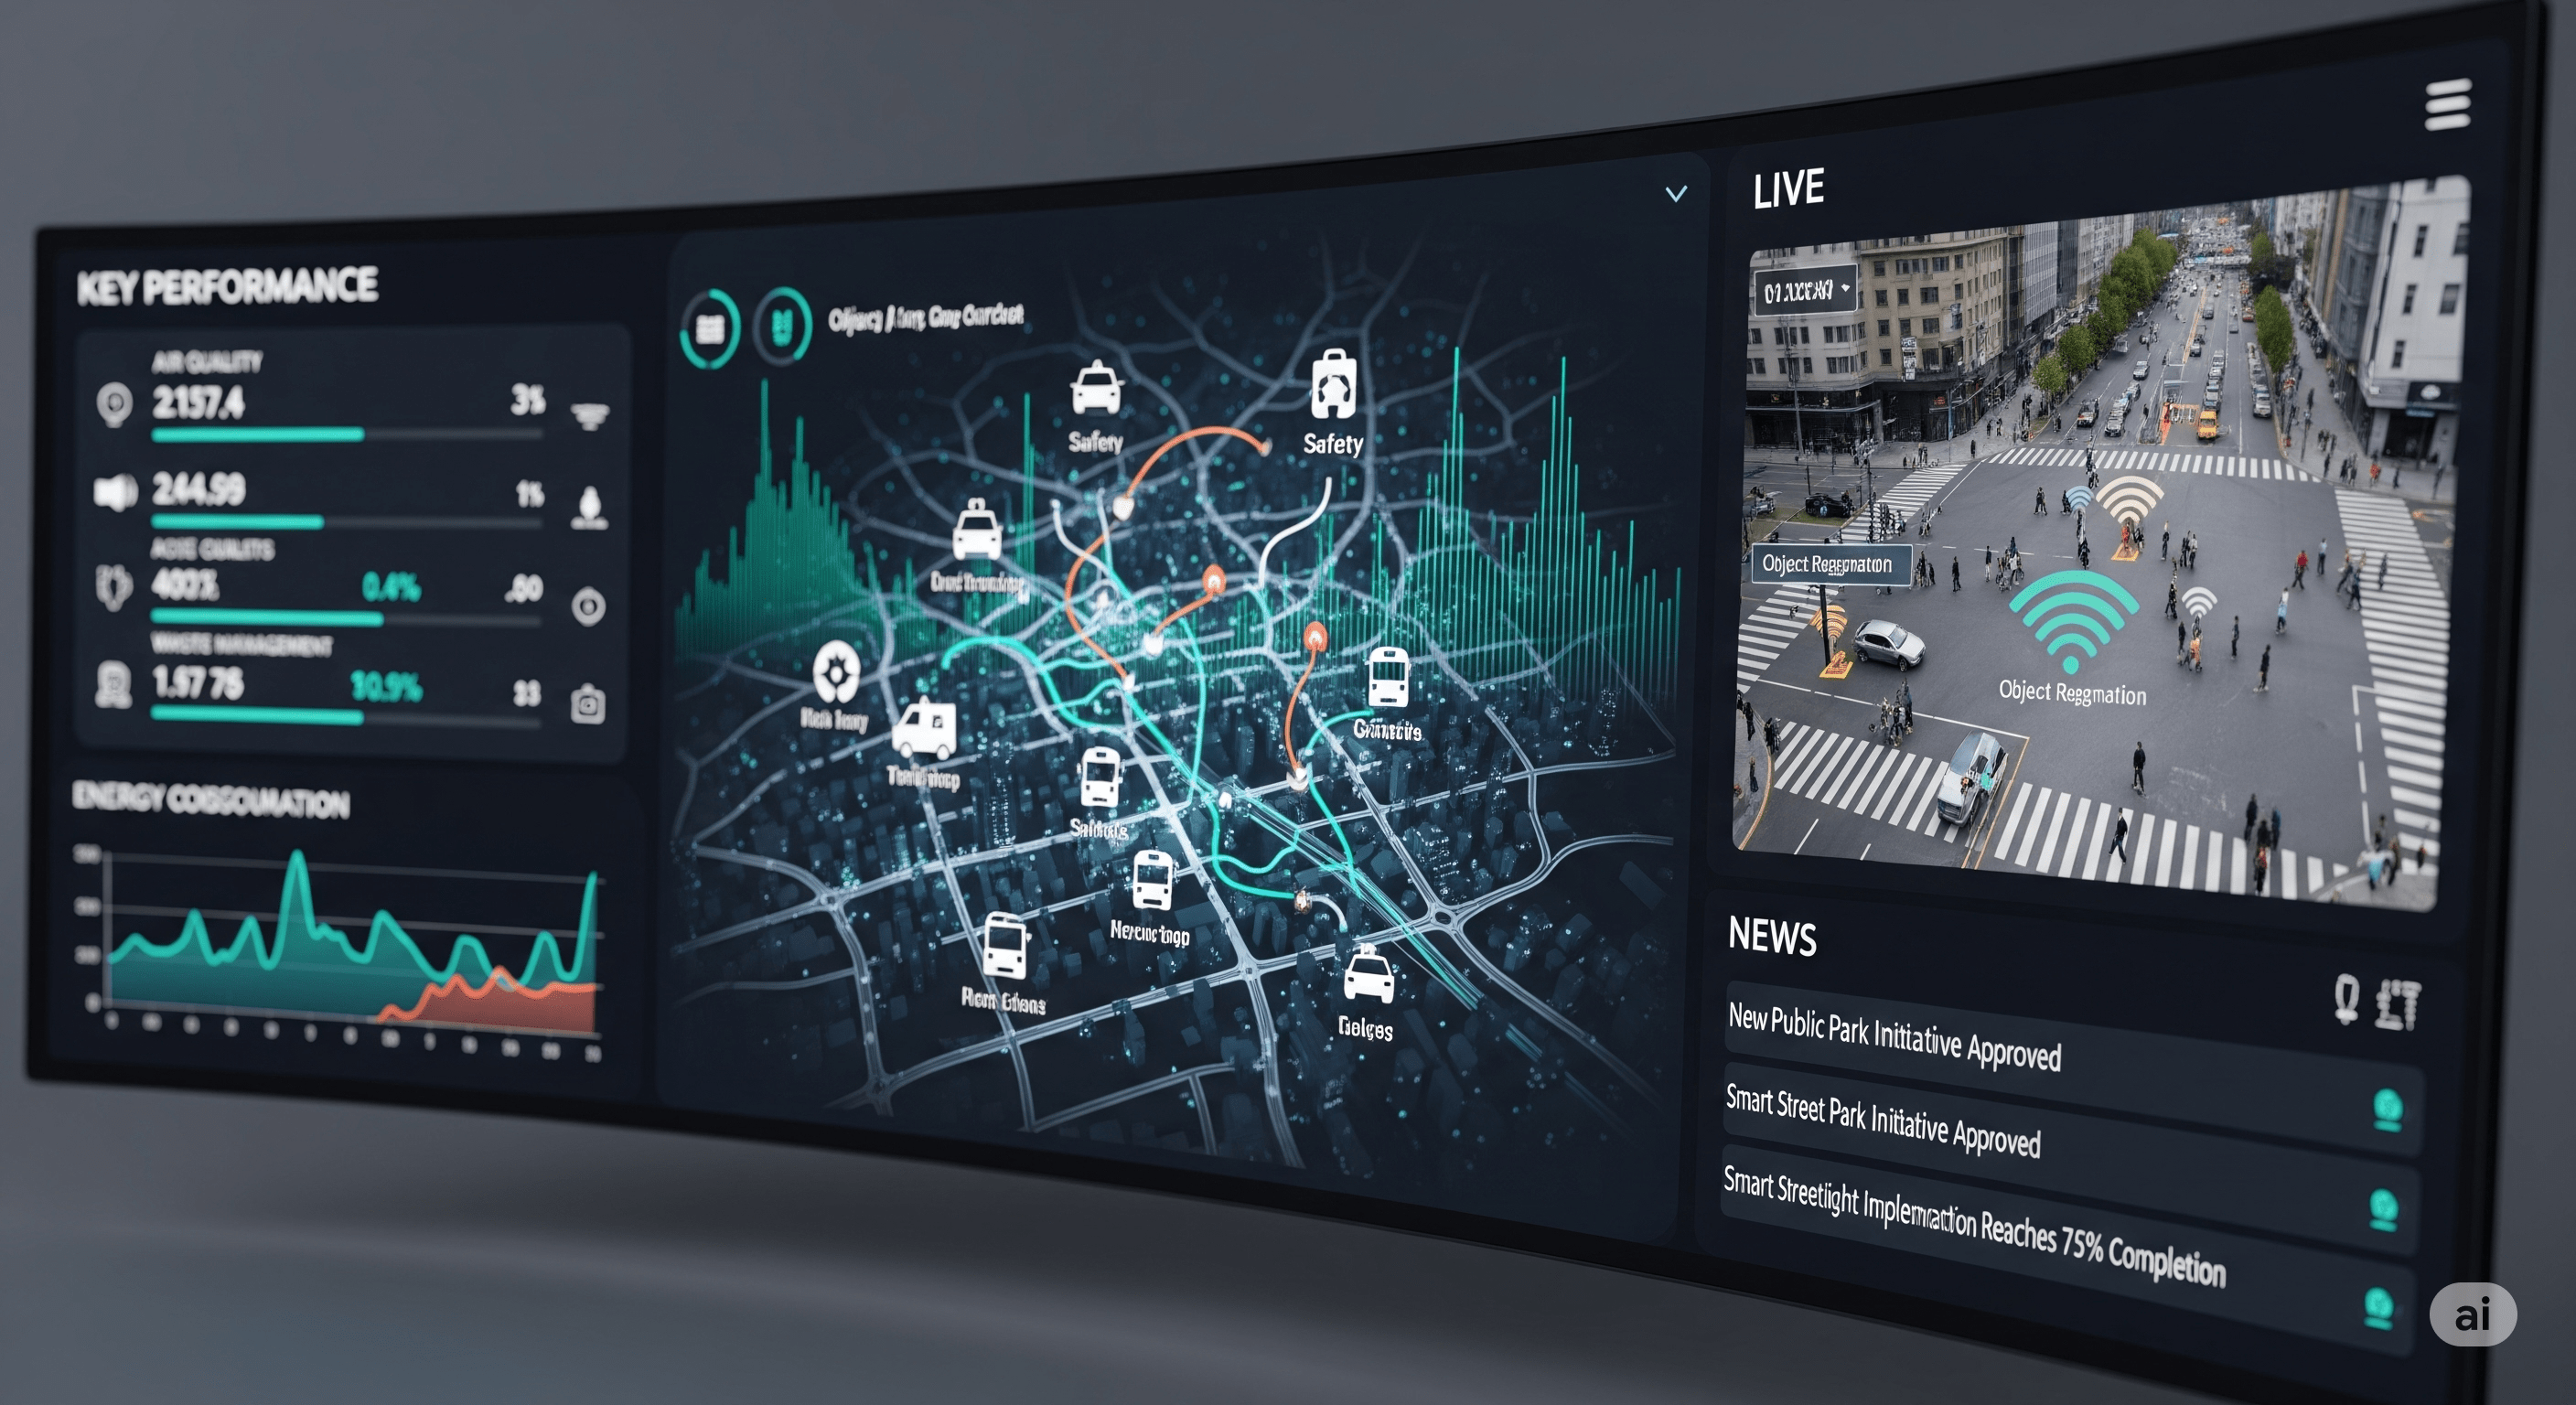
Building a Scalable Urban Intelligence Platform with MQTTfy Dashboard
Smart cities are no longer conceptual pilots or isolated technology experiments. They are living, data-driven ecosystems that rely on real-time telemetry, distributed sensors, edge computing, and scalable messaging infrastructure. At the center of this transformation is a lightweight communication backbone powered by MQTT, connected to intelligent visualization platforms like MQTTfy Dashboard. This article is a detailed cluster page supporting our main MQTT Dashboard guide.
This case study explores how a mid-sized metropolitan municipality deployed a unified smart city monitoring system using an MQTT-based architecture. The result was a scalable, secure, and cost-efficient urban intelligence platform capable of managing traffic, environmental monitoring, smart lighting, waste management, and public safety analytics — all visualized through MQTTfy Dashboard.
1. City Background and Objectives
City Profile
- Population: 1.8 million
- Area: 240 square kilometers
- Smart Infrastructure Budget: ₹85 Crores
- Connected Devices (Phase 1): 12,500
- Expansion Target: 75,000 devices
The municipality faced growing challenges:
- Increasing traffic congestion
- Poor air quality monitoring coverage
- High streetlight energy consumption
- Inefficient waste collection routes
- Limited real-time data visibility
- Manual reporting processes
Their goal was to implement a centralized smart city IoT platform that could:
- Collect real-time sensor data
- Provide live dashboards for city control rooms
- Enable automated alerts
- Reduce operational expenditure
- Scale across multiple departments
2. Why MQTT for Smart City Infrastructure?
The city evaluated multiple communication protocols but selected MQTT.
Key Reasons:
- Lightweight protocol suitable for low-bandwidth networks
- Publish/Subscribe architecture for distributed environments
- Efficient over unreliable cellular networks
- Supports Quality of Service (QoS) levels
- Ideal for large-scale IoT device fleets
Unlike HTTP polling systems, MQTT allows devices to publish telemetry only when needed, significantly reducing bandwidth usage — critical for city-wide deployments.
3. Smart City Architecture Overview
The architecture followed a layered IoT model:
-
Edge Device Layer
Sensors installed across the city:
- Air quality monitors
- Traffic flow sensors
- Smart streetlights
- Smart waste bins
- Water level sensors
- Noise pollution meters
-
Gateway Layer
Edge gateways aggregated:
- BLE and LoRa sensor data
- Performed local filtering
- Converted payloads to JSON
- Published to MQTT broker
-
MQTT Broker Layer
A clustered MQTT broker handled:
- 500K+ messages per hour
- TLS encryption
- Department-level topic isolation
- Persistent sessions
-
MQTTfy Dashboard Layer
All data visualized through MQTTfy Dashboard:
- Real-time city maps
- Heatmaps
- Alert panels
- Department dashboards
- KPI analytics
This architecture ensured modularity, scalability, and centralized visibility.
4. Use Case 1 – Intelligent Traffic Monitoring
Traffic congestion was one of the city's biggest challenges.
Problem
- Peak-hour congestion delays
- No live traffic analytics
- Manual signal timing adjustments
Implementation
Traffic sensors installed at 120 intersections:
- Vehicle count
- Average speed
- Queue length
- Signal timing feedback
Each intersection published data under structured MQTT topics:
city/traffic/intersection45/vehiclecountcity/traffic/intersection45/averagespeed
An MQTTfy Dashboard displayed:
- Live congestion heatmaps
- Historical trend comparisons
- Signal optimization alerts
Results
- 18% reduction in average congestion time
- 12% fuel savings across monitored zones
- Dynamic signal timing integration in Phase 2
5. Use Case 2 – Environmental Monitoring
Air pollution monitoring was previously limited to 6 manual stations. This is a large-scale version of the system described in our environmental monitoring case study.
Deployment
150 air quality sensors measuring:
- PM2.5
- PM10
- CO2
- NO2
- Temperature & humidity
Data transmitted every 60 seconds.
Dashboard Features
- City-wide AQI heatmap
- Zone-wise pollution graphs
- Threshold-based alerts
- Historical comparison charts
Impact
- Identified 3 high-pollution hotspots
- Triggered traffic rerouting strategies
- Enabled public health advisory alerts
6. Use Case 3 – Smart Street Lighting
Streetlights accounted for 38% of municipal electricity costs, a problem similar to one in our energy management case study.
Problem
- Lights running at full intensity overnight
- No remote fault detection
- High maintenance cost
Solution
Connected LED streetlights with MQTT-enabled controllers. Each light published:
city/lighting/zone3/pole223/statuscity/lighting/zone3/pole223/energy
Features Implemented
- Dimming based on traffic density
- Fault detection alerts
- Energy consumption tracking
- Centralized ON/OFF scheduling
Results
- 32% reduction in electricity consumption
- 40% faster fault resolution
- Reduced maintenance dispatch cost
7. Use Case 4 – Smart Waste Management
Waste collection inefficiencies caused:
- Overflowing bins
- Public complaints
- Inefficient route planning
Implementation
Smart bins equipped with fill-level sensors. Data published via MQTT: city/waste/zone5/bin44/filllevel
An MQTTfy Dashboard enabled:
- Real-time bin status
- Route optimization planning
- Alert notifications for 80% threshold
Outcome
- 27% reduction in fuel costs
- 35% fewer overflow incidents
- Improved citizen satisfaction
8. Data Modeling and Topic Hierarchy Strategy
Smart city deployments fail without structured topic design. The city adopted: city/department/zone/device/metric, a core principle for large scale projects like this and our industrial monitoring case study.
Examples:
city/traffic/zone1/intersection12/vehiclecountcity/environment/zone4/sensor33/pm25
Benefits:
- Department isolation
- Easy wildcard subscription
- Scalable expansion
- Simplified dashboard mapping
9. Real-Time Visualization Using MQTTfy Dashboard
The city control center used MQTTfy Dashboard as its operational hub. This dashboard was designed following the principles of building an effective IoT dashboard.
Key features implemented:
- City-wide KPI overview
- Department-specific dashboards
- Live alert stream
- Heatmaps
- Historical time-series analysis
- Role-based access control
Different departments accessed customized dashboards:
- Traffic control room
- Environmental authority
- Energy department
- Waste management team
The dashboard unified all city intelligence in one interface.
10. Security Framework
Urban IoT requires strict security controls.
| Layer | Implementation |
|---|---|
| Transport Security | TLS 1.2 encryption, Certificate-based broker validation |
| Authentication | Unique client IDs per device, Token rotation, Device whitelisting |
| Access Control | Topic-level ACL rules, Department-based permissions |
| Network Segmentation | VLAN isolation, Firewall segmentation, DMZ for broker cluster |
No security incidents reported since launch.
11. Deployment Timeline
- Phase 1 – Pilot (3 Zones)
- 2,000 devices
- 60-day evaluation
- Network reliability testing
- Phase 2 – City-Wide Rollout
- 12,500 devices
- 9-month deployment
- Centralized MQTT cluster
12. Performance Metrics
- 99.4% message delivery reliability
- 1.3 seconds average alert latency
- 99.92% system uptime
- 600K messages/hour broker throughput
13. Financial Impact
| Metric | Value |
|---|---|
| Total Investment | ₹85 Crores |
| Annual Savings (Energy) | ₹12 Crores |
| Annual Savings (Waste Mgmt) | ₹4 Crores |
| Economic Impact (Traffic) | ₹9 Crores |
| Projected ROI | 5.2 years |
14. Scalability Blueprint
Planned expansion:
- Smart water management, similar to our aquaculture case study
- Flood detection system
- Public transport tracking (fleet management)
- AI-driven predictive traffic modeling
- Retail analytics for public markets
Architecture supports:
- 200K+ devices
- Horizontal broker scaling
- Cloud-native expansion
- Multi-city replication
15. Lessons Learned
- Start with pilot zones
- Design topic hierarchy before deployment
- Secure endpoints from day one
- Monitor broker performance continuously
- Use edge filtering to reduce noise
- Design dashboards for decision-makers
16. Why This Case Study Strengthens MQTTfy Dashboard Authority
This smart city deployment proves an MQTTfy Dashboard can:
- Handle multi-department data streams
- Support massive device fleets
- Provide real-time urban intelligence
- Deliver secure, scalable visualization
- Integrate with smart infrastructure
It demonstrates real-world production-grade capability — not theoretical architecture. Effective data visualization is crucial for making sense of this much data.
17. Conclusion
Smart cities require a communication backbone that is lightweight, scalable, secure, real-time, and cost-efficient. By combining MQTT messaging infrastructure with an MQTTfy Dashboard visualization, this municipality transformed fragmented systems into a unified urban intelligence platform.
The deployment:
- Reduced operational costs
- Improved public services
- Enabled data-driven governance
- Created a scalable digital foundation
Smart city infrastructure powered by MQTT is not experimental — it is operational, scalable, and future-ready. And at the center of that visibility layer stands MQTTfy Dashboard, converting millions of telemetry messages into actionable city intelligence.
Frequently Asked Questions
What is LoRaWAN and why is it used for smart cities?
LoRaWAN (Long Range Wide Area Network) is a wireless communication protocol designed for low-power, long-range IoT devices. It's ideal for smart cities because it allows battery-powered sensors (like in waste bins or parking spots) to send small amounts of data over many kilometers to a central gateway, making it highly cost-effective for covering a large urban area.
How does MQTT help integrate different city services?
MQTT acts as a universal message bus. A sensor for air quality and a sensor for a broken streetlight might use totally different hardware and data formats. However, they both publish their data to a central MQTT broker. This decouples the data source from the application. A dashboard, a mobile app, or a database can subscribe to any data stream they need without having to communicate directly with the sensors, making the entire system incredibly flexible and scalable.
What is dynamic routing for waste collection?
Instead of having garbage trucks follow the same fixed route every week, dynamic routing uses real-time data from smart bin sensors. A central system analyzes which bins are actually full and generates a new, optimized route each day to service only those bins. This drastically reduces fuel consumption, labor costs, and vehicle wear-and-tear.
How can a dashboard show thousands of sensors on one map?
Modern dashboarding tools like MQTTfy are highly optimized for large-scale data visualization. A map widget doesn't just plot individual points. It often uses client-side clustering, where thousands of nearby sensors are grouped into a single, numbered icon. As you zoom in, these clusters break apart, revealing the individual sensors. This, combined with wildcard MQTT subscriptions ('city/+/bin/+/fill_level'), makes it possible to efficiently visualize an entire city's worth of assets.
Can citizens access this smart city data?
Yes, and this is a key benefit of using a decoupled MQTT architecture. The city can create public-facing dashboards or mobile apps that subscribe to a subset of the MQTT topics, like public transit locations ('city/transit/bus/+/location') or available parking spots. This empowers citizens with real-time information, improving their quality of life.