Case Study: Transforming Agriculture with MQTT, BLE, and Real-Time Dashboards
February 22, 2026
Introduction: Agriculture Enters the Intelligence Era
Modern agriculture is moving beyond traditional methods, embracing data-driven cultivation powered by IoT sensors, real-time analytics, and cloud dashboards. This case study details how a 420-acre commercial farm partnered with MQTTfy to deploy a smart farming solution, transforming their operations and achieving significant gains in efficiency, yield, and profitability. This article is a detailed cluster page supporting our main MQTT Dashboard guide.
1. The Challenge: Overcoming Agricultural Inefficiencies
This commercial farm, specializing in high-value crops like tomatoes and pomegranates, faced substantial operational challenges. With no centralized monitoring, they struggled with:
- Resource Waste: Over-irrigation was common, leading to water loss and nutrient washout.
- Manual Labor: Soil moisture was checked manually, a time-consuming and inconsistent process.
- Delayed Responses: Crop disease, pest risks, and equipment failures (like pump malfunctions) were often detected late, causing preventable losses.
- Lack of Data: With no historical data, optimizing crop strategies was based on guesswork, not evidence.
These inefficiencies resulted in an estimated loss of ₹35–45 Lakhs per year.
2. The Solution: A Scalable IoT Architecture with MQTT and BLE
To address these challenges, the farm implemented a robust IoT system built on three core technologies:
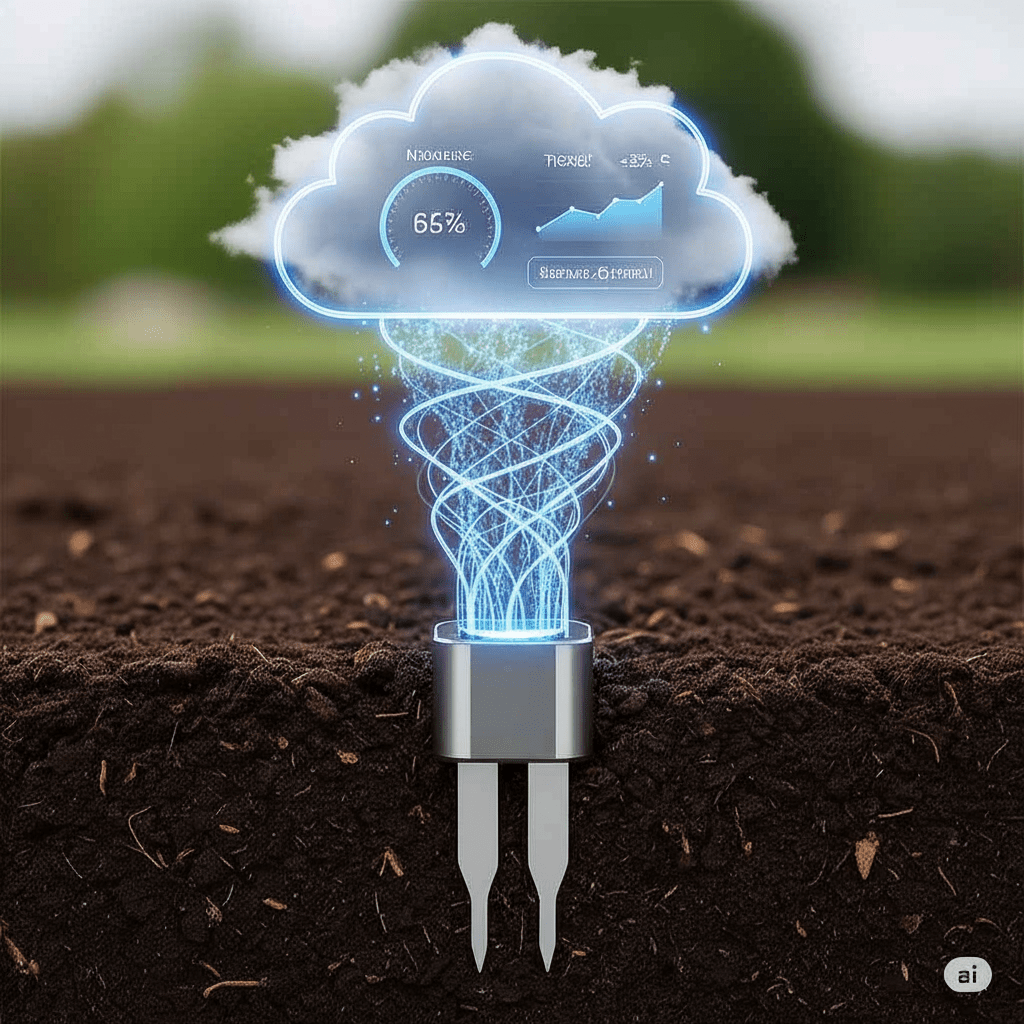
- Bluetooth Low Energy (BLE) Sensors: Chosen for their ultra-low power consumption and affordability, allowing for dense deployment without wiring.
- Edge Gateways: Solar-powered gateways bridge the gap between low-power field sensors and the cloud, collecting data and publishing it via a 4G connection.
- MQTT Protocol: The lightweight and reliable MQTT publish-subscribe protocol was selected as the communication backbone, ensuring data delivery even in areas with unreliable connectivity.
The entire system was visualized and managed through the MQTTfy Dashboard, providing a central command center for the entire operation.
3. Implementation: From Pilot to Full-Scale Deployment
The project was rolled out in two phases:
- Phase 1: Pilot (50 Acres): A 45-day trial validated the technology, confirming BLE range, sensor durability (projecting a 12-month battery life), and sub-2-second dashboard latency.
- Phase 2: Full Rollout: Following the successful pilot, 980 sensors and 11 gateways were deployed across all 420 acres in just 38 days.
A structured MQTT topic hierarchy (organization/location/zone/device/metric) was crucial for managing the large volume of data and ensuring the system could scale.
4. Core Features & Use Cases
The integrated system unlocked powerful new capabilities:
- Smart Irrigation Automation: By setting moisture thresholds (e.g., irrigate below 28%, stop above 45%), the system automated irrigation controls via MQTT commands, leading to a 32% reduction in water usage.
- Proactive Alerting: Real-time alerts for critical events like low moisture, high heat stress, or pump failures were sent via SMS, WhatsApp, and the MQTTfy Dashboard, enabling rapid response.
- Predictive Agriculture Insights: Historical data, visualized in the MQTTfy Dashboard, allowed for trend analysis, helping to optimize irrigation strategies and increase tomato yield by 14%. Effective data visualization was key to this success.
- Robust Security: A multi-layered security model including TLS encryption, device authentication tokens, and topic-level access control ensured the integrity and safety of the farm's data.
5. The Impact: Measurable ROI and Sustainable Gains
The transformation from manual operations to data-driven management delivered substantial returns:
| Metric | Result |
|---|---|
| Water Savings | 32% Reduction |
| Crop Yield Increase (Tomato) | 14% Increase |
| Total Annual Gain | ₹40 Lakhs |
| Return on Investment (ROI) | 9.6 Months |
| Manual Inspection Reduction | 42% |
Beyond the financial benefits, the project had a significant environmental impact, reducing water consumption, fertilizer runoff, and the farm's overall carbon footprint, similar to the goals in our environmental monitoring article.
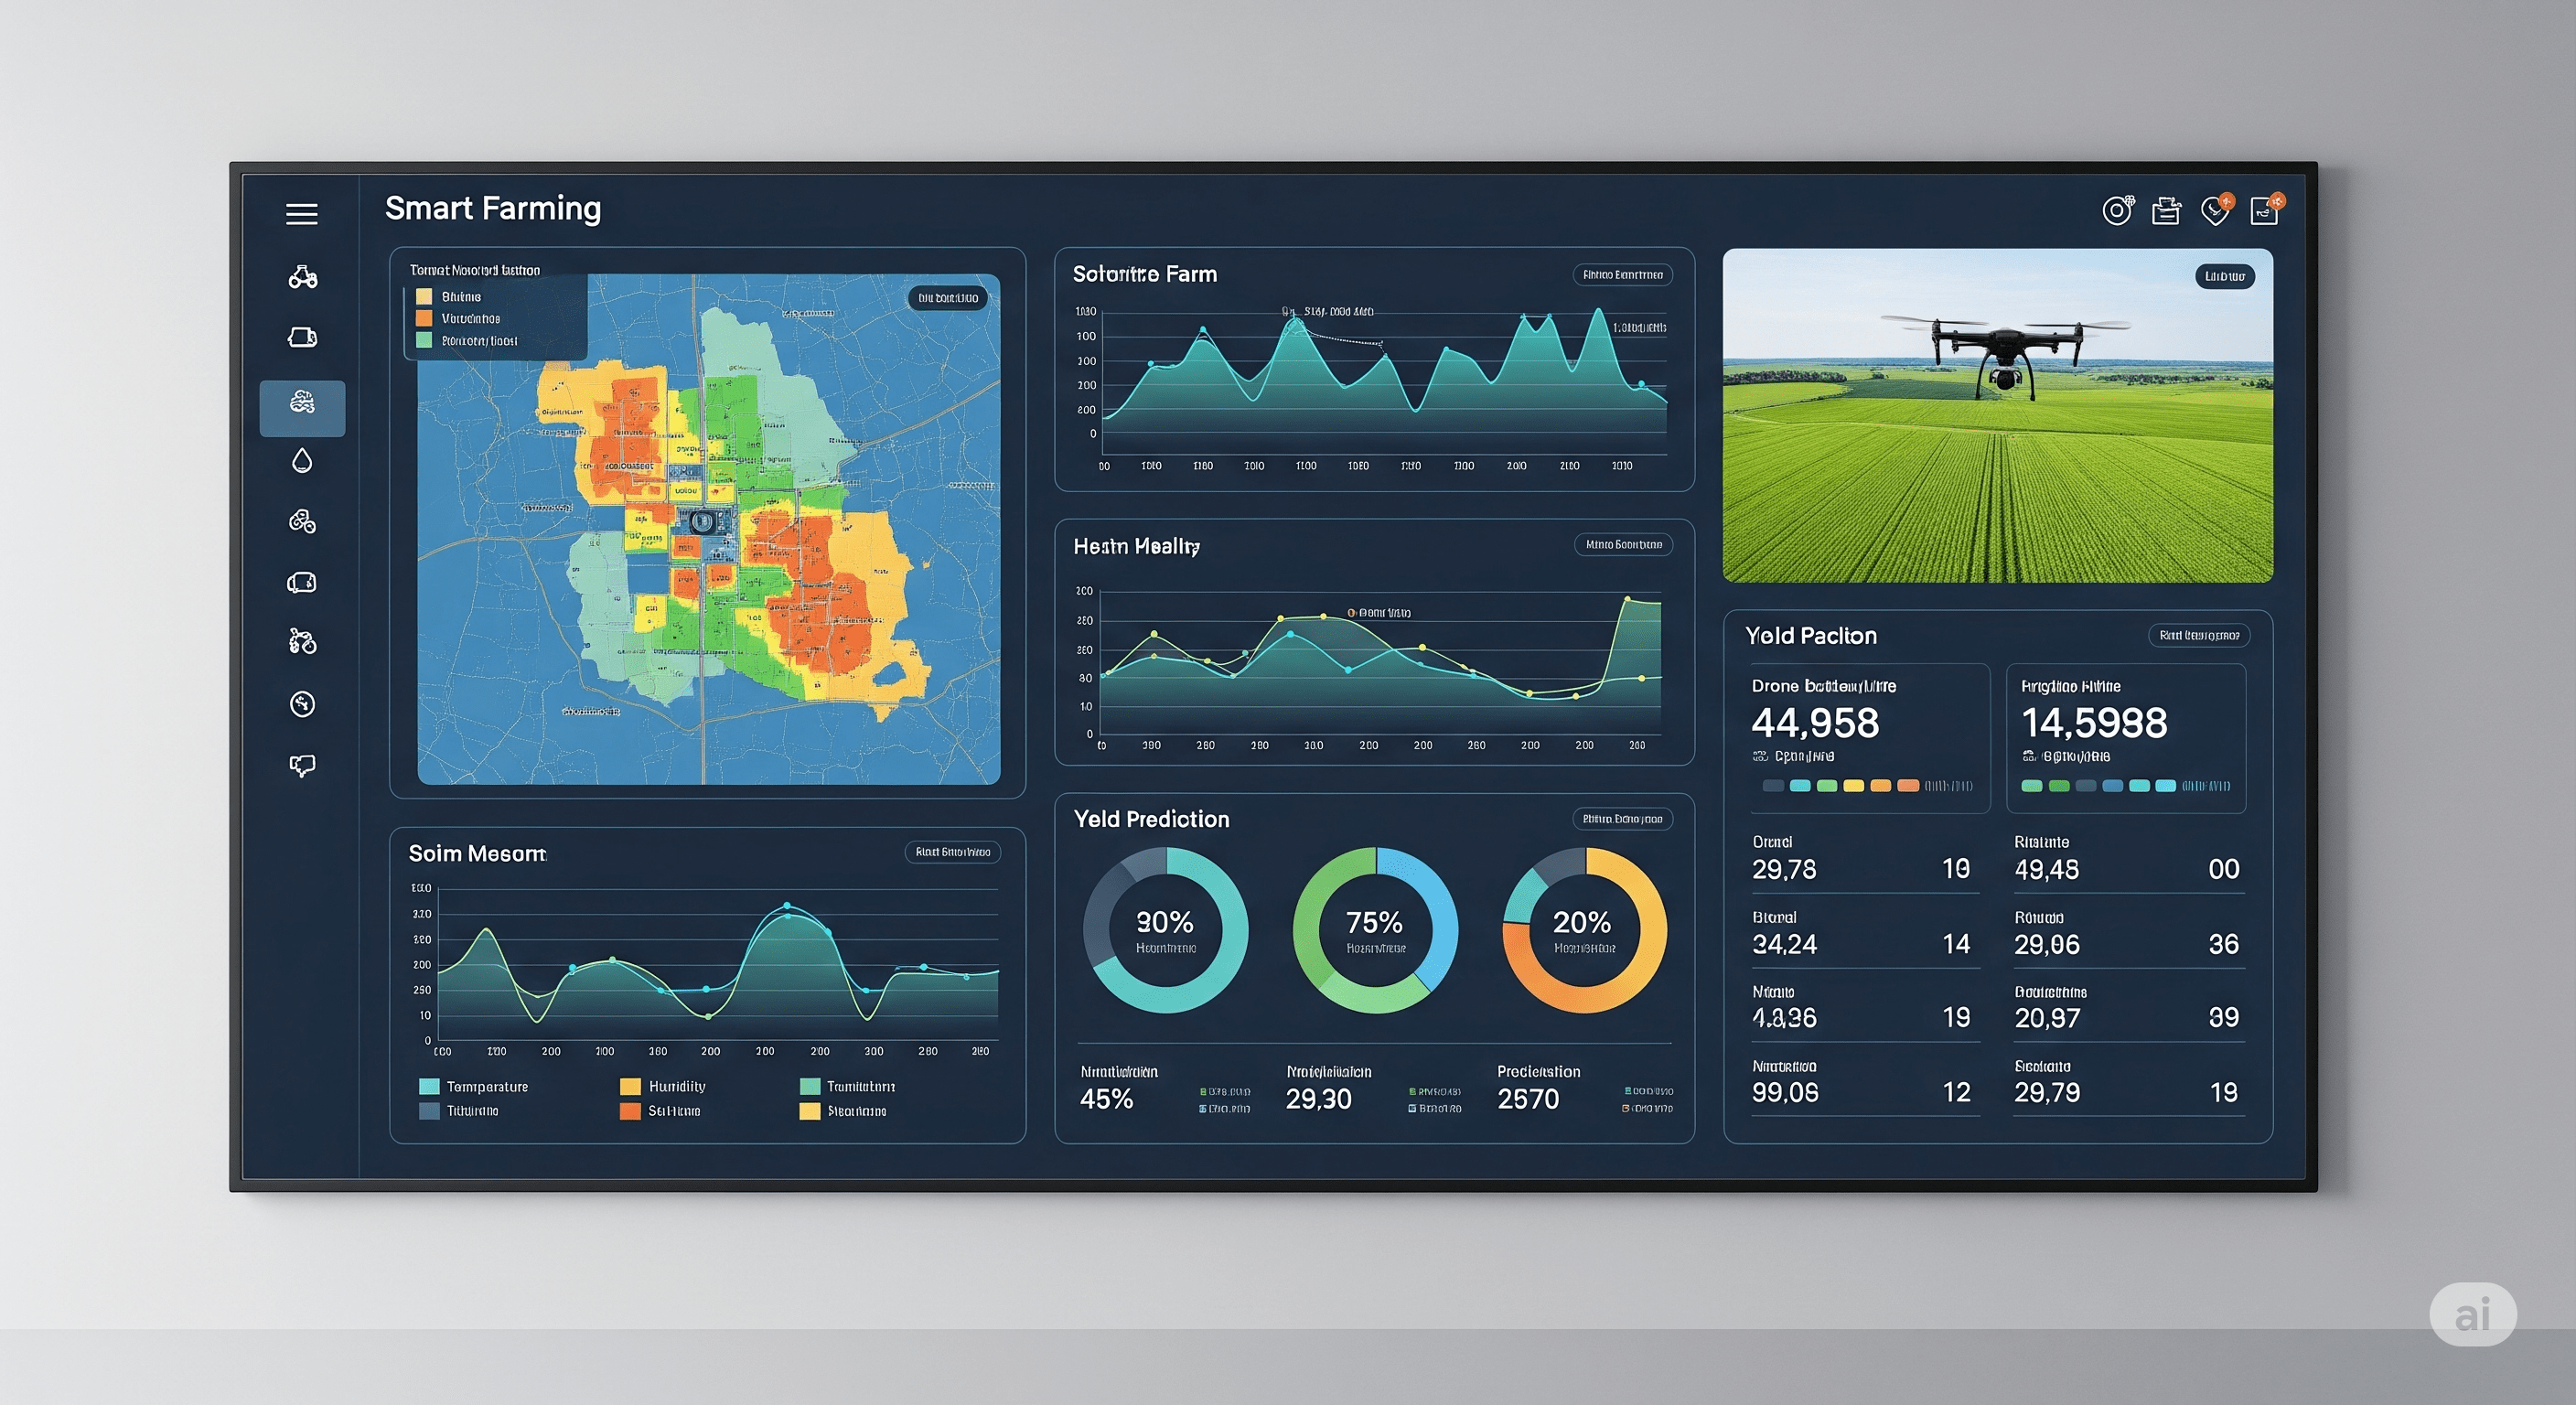
6. The MQTTfy Dashboard: A Centralized Farm Command Center
The MQTTfy Dashboard became the nerve center of the farm. It provided:
- Real-time Visibility: Live moisture heatmaps, zone-based status panels, and water tank gauges.
- Remote Control: Centralized command of irrigation valves and pumps.
- Actionable Insights: Historical trend charts and crop performance monitoring.
This central hub, designed with principles from our guide to building effective IoT dashboards, reduced the need for physical field inspections by 42% and empowered farm managers with the data to make faster, more informed decisions.
7. Future Vision & Lessons Learned
The success of this project has paved the way for future expansion, including integrating drone imagery with our camera widget, AI-based disease prediction, and autonomous fertilization systems. The scalable MQTT architecture is ready to support this growth.
Key Lessons:
- A structured topic hierarchy is non-negotiable for scalability, a principle that applies to diverse fields like fleet management.
- Always pilot in real-world conditions before a full rollout.
- Proactive monitoring of sensor battery levels is crucial for systems like this and industrial monitoring setups.
- Design dashboard views around the needs of the end-user, a universal rule for any MQTT dashboard.
Conclusion: The Future of Farming is Data-Driven
This case study proves that a well-designed IoT system using BLE, MQTT, and a powerful visualization platform like the MQTTfy Dashboard can deliver a rapid and substantial return on investment. By moving from intuition-based farming to data-driven intelligence, this farm not only increased profitability but also built a more sustainable and resilient operation. Smart farming is no longer an experiment; it is an economic and environmental necessity, with applications in aquaculture as well.
Frequently Asked Questions
Why is BLE a good choice for smart farming?
Bluetooth Low Energy (BLE) is excellent for smart farming in dense sensor deployments. It allows battery-powered sensors to communicate efficiently over short to medium distances to a local gateway. This is ideal for scenarios where many sensors are placed within a few acres, as it offers a very low-power and cost-effective way to create a local sensor mesh network that then connects to the cloud via a single gateway.
How does data from a BLE sensor get to an MQTT dashboard?
The data flows in a chain: 1) The BLE sensor broadcasts its data. 2) An in-field Edge Gateway scans for these BLE advertisements. 3) The Gateway parses the data, converts it to a structured JSON format, and publishes it to an MQTT broker over a cellular or Wi-Fi connection. 4) The MQTT dashboard, which is subscribed to the broker, receives and displays this data in real-time.
What is an edge gateway in agriculture?
An edge gateway is a rugged computing device placed in the field. Its job is to act as a bridge between the low-power local sensors (like BLE) and the main cloud network. It collects data from hundreds of nearby sensors, can perform local processing or filtering, and then uses a more powerful connection (like 4G/LTE) to send the aggregated data to the MQTT broker, saving costs on individual SIM cards for each sensor.
Can I automate my irrigation system with this technology?
Yes. The MQTT architecture is perfect for two-way communication. Your dashboard or a separate automation engine can monitor soil moisture levels from MQTT topics. When a level drops below a set threshold, it can publish a command message to a different topic (e.g., 'farm1/zoneC/irrigation/set'). A relay connected to the irrigation valve subscribes to this topic and will turn the valve ON or OFF based on the command received.
What is a good MQTT topic structure for a farm with multiple zones?
A robust structure uses a clear hierarchy, for example: 'farm1/zoneC/plot12/soil/moisture' for sensor readings and 'farm1/zoneC/plot12/valve/set' for sending commands. This pattern ('organization/location/zone/device/metric') makes it easy to add thousands of sensors across many farms and zones while keeping the data perfectly organized and easy to manage on the dashboard.