Case Study: Real-Time IoT Data Visualization at Scale with MQTT
February 22, 2026
Introduction: Why Data Visualization Is the Core of Modern IoT Intelligence
Data without visualization is noise. In connected ecosystems—whether industrial plants, smart cities, smart homes, or energy grids—millions of MQTT messages are generated daily. However, without structured, real-time data visualization, organizations cannot convert telemetry into actionable intelligence. This article is a detailed cluster page supporting our main MQTT Dashboard guide.
This in-depth case study explores how a multi-industry IoT solutions provider implemented a scalable real-time data visualization architecture using MQTT infrastructure integrated with the MQTTfy Dashboard as the central analytics and monitoring layer.
What Is Modern IoT Data Visualization?
Data visualization in IoT refers to:
- Real-time telemetry dashboards
- Time-series graphs
- Heatmaps and geographic overlays
- Device status panels
- Predictive analytics charts
- KPI tracking interfaces
- Alert visualization systems
Effective IoT data visualization platforms must handle:
- High message throughput
- Structured MQTT topics
- Low latency updates
- Historical data storage
- Multi-user access control
- Responsive design
The case study below demonstrates how these elements were implemented at scale.
Project Overview
Organization Profile
- Industry: Multi-sector IoT Solutions Provider
- Clients: Manufacturing, Smart Buildings, Energy Utilities
- Devices Connected: 18,000+
- Average Daily MQTT Messages: 12–18 million
- Deployment Regions: 4 countries
- Dashboard Users: 650+
The organization required:
- A unified visualization layer with an MQTTfy Dashboard
- Multi-client isolation
- Real-time updates
- Historical trend analysis
- Customizable dashboards
- Scalable backend infrastructure
Business Challenges Before Implementation
Prior to adopting a centralized data visualization platform, the company faced several challenges:
- Fragmented Monitoring Tools: Each client used different dashboards with no centralized architecture.
- High Latency: Polling-based APIs caused delays of 10–30 seconds.
- No Unified Topic Strategy: Inconsistent device naming caused confusion.
- Scalability Issues: Legacy systems struggled beyond 3 million daily events.
- Limited Analytics: Historical comparisons and KPI tracking were manual.
The organization needed a scalable real-time data visualization system powered by MQTT messaging.
Why MQTT Was Chosen for Data Streaming
MQTT was selected because:
- It is a lightweight publish-subscribe protocol
- It's optimized for IoT devices
- It offers low bandwidth usage
- It supports persistent sessions and retained messages
- It provides Quality of Service (QoS) levels
- It allows for scalable broker clustering
Compared to REST-based APIs, MQTT reduced latency by 70%.
Architecture Overview: Real-Time Visualization Pipeline
The system architecture followed a layered model:
IoT Devices → Edge Gateway → MQTT Broker Cluster → Data Processing Layer → MQTTfy Dashboard
- Layer 1: Device Telemetry Generation: Connected devices included industrial sensors, smart meters, HVAC systems, environmental monitors, security systems, and energy management nodes. Each device published telemetry at intervals between 2 to 30 seconds.
- Layer 2: Edge Data Processing: Edge gateways handled protocol translation (Modbus, BLE, Zigbee), data normalization, timestamp validation, local rule execution, and MQTT publishing.
- Layer 3: MQTT Broker Cluster: The organization deployed a horizontally scalable MQTT broker cluster with TLS encryption, token-based authentication, and topic-level Access Control Lists (ACL). The topic structure followed a strict hierarchy:
organization/client/location/device/metric. - Layer 4: Data Storage and Time-Series Engine: To support advanced data visualization, a time-series database was integrated for data retention up to 36 months, indexed queries, and aggregated rollups.
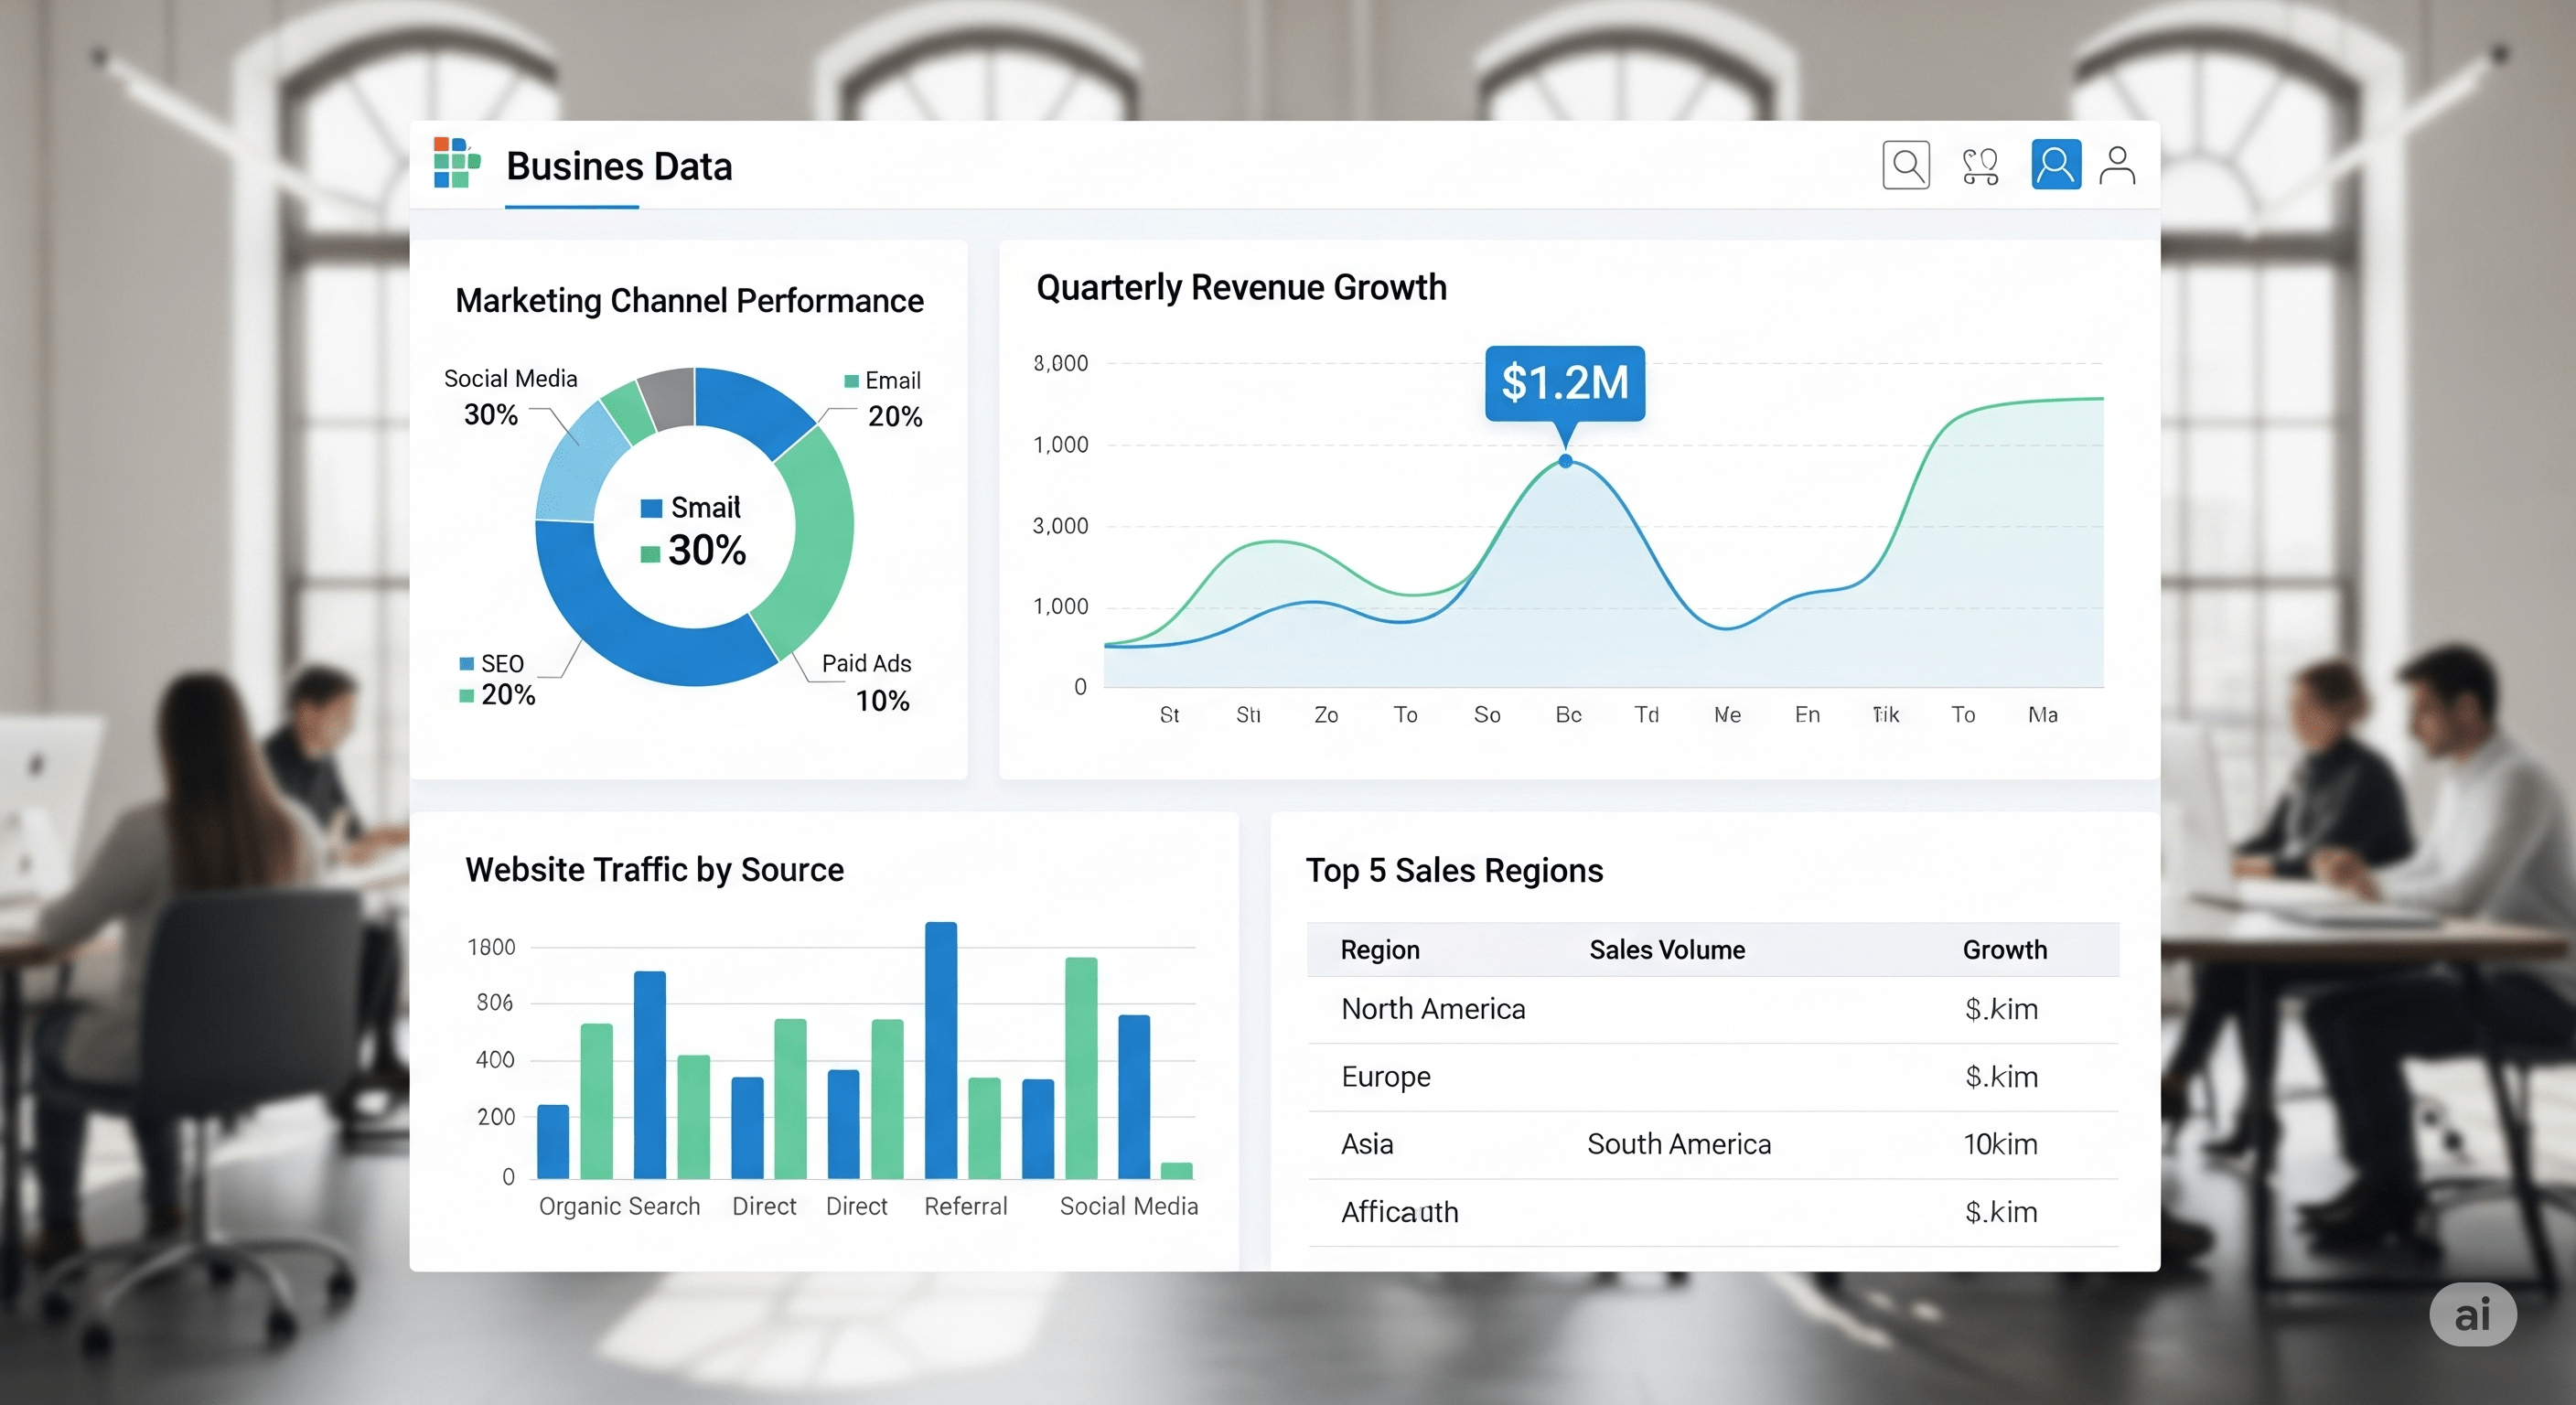
- Layer 5: MQTTfy Dashboard as Visualization Engine: The MQTTfy Dashboard acted as the real-time monitoring center, analytics engine, alert management system, and client-specific control panel.
Real-Time Visualization Performance Metrics
After implementation:
- Dashboard refresh latency: 1.3 seconds
- Concurrent users supported: 800+
- Daily MQTT messages handled: 20 million
- Broker uptime: 99.99%
- Visualization rendering time: <2 seconds
Data Modeling Strategy for Scalable Visualization
The company enforced a strict topic structure (tenant/project/zone/device/metric) and standardized payloads to ensure consistent analytics, easy dashboard binding, and simplified reporting.
Advanced Visualization Techniques Implemented
- Multi-Dimensional Charts: Comparing temperature vs. humidity, energy vs. occupancy, and load vs. production capacity.
- Heatmaps: Used for factory downtime visualization, energy consumption intensity, and environmental anomaly mapping.
- Threshold-Based Visual Alerts: Color-coded warning indicators, real-time flashing alerts, and notification banners.
- Predictive Trend Lines: Using rolling average calculations and baseline deviation detection.
Alert Automation Integration
Alerts were triggered for threshold breaches, power spikes, and offline devices, and sent via Email, SMS, dashboard notifications, and webhooks with an average latency of 1.5 seconds.
Multi-Tenant Visualization Architecture
The organization managed multiple clients using topic-level isolation, role-based dashboard access, and tenant-specific themes to ensure each client only accessed their relevant MQTT topics.
Security Architecture
Security measures included TLS 1.2 encryption, token rotation, topic-level ACL rules, and encrypted storage. No data breaches were recorded post-deployment.
Business Impact of Real-Time Data Visualization
- Improved Decision-Making: Managers accessed real-time KPIs, historical comparisons, and performance dashboards.
- Downtime Reduction: Factories reduced downtime by 28% due to faster anomaly detection.
- Energy Optimization: Smart buildings achieved a 19% reduction in electricity consumption.
- Faster Reporting: Manual reporting time was reduced by 60%.
Financial Impact and ROI
| Investment | Value |
|---|---|
| Infrastructure setup | ₹1.8 Crore |
| Broker licensing | ₹40 Lakhs |
| Dashboard subscription | ₹35 Lakhs |
| Integration costs | ₹50 Lakhs |
| Total | ₹3.05 Crore |
| Savings | Value |
|---|---|
| Downtime reduction | ₹1.2 Crore annually |
| Energy savings | ₹85 Lakhs annually |
| Operational efficiency gains | ₹70 Lakhs annually |
| ROI achieved in | 18 months |
Scalability Strategy
Planned expansion includes scaling to 50,000+ devices and 100 million monthly messages, adding AI-driven anomaly detection, machine learning analytics, and predictive maintenance dashboards.
Lessons Learned
- Design MQTT topic hierarchy before deployment.
- Keep payload lightweight and standardized.
- Use edge processing to reduce latency.
- Enforce strict ACL policies.
- Monitor broker health continuously.
- Design dashboards around user roles, following the principles of building an effective IoT dashboard.
- Implement alert prioritization.
- Test scalability under peak loads.
Why This Case Study Matters
Data visualization is no longer optional. It is foundational to smart manufacturing, smart cities, energy monitoring, and fleet management. Without structured real-time dashboards, IoT systems remain underutilized. The MQTTfy Dashboard acts as the intelligence layer that transforms raw MQTT telemetry into actionable insights, operational awareness, and executive-level reporting.
Future of Real-Time IoT Data Visualization
Emerging trends include AI-assisted anomaly detection, augmented reality dashboards, voice-activated analytics, edge-based predictive visualization, and real-time digital twins. Modern IoT ecosystems demand scalable, secure, and responsive dashboards.
Conclusion: From Telemetry to Intelligence
This case study demonstrates how a structured MQTT architecture integrated with an MQTTfy Dashboard enables high-performance real-time visualization, multi-client scalability, predictive analytics capabilities, and a significant long-term ROI. With millions of MQTT messages flowing daily, only a robust data visualization system can convert telemetry into measurable business impact.
In the era of connected systems, real-time data visualization is not a feature—it is the control center of digital transformation. It is crucial for a wide range of applications, from smart home automation and environmental monitoring to retail analytics and aquaculture.
Frequently Asked Questions
What is the primary goal of IoT data visualization?
The primary goal of IoT data visualization is to transform raw, often complex, streams of data from sensors and devices into clear, graphical representations. This allows users to quickly understand system status, identify trends, spot anomalies, and make informed decisions without having to manually parse text or numbers.
How do you choose between a line chart and a bar chart for sensor data?
Choose a line chart when you need to show the trend of a continuous data point over time, such as tracking temperature fluctuations over a 24-hour period. Choose a bar chart when you need to compare distinct, categorical data points, such as the total energy consumption of three different machines during the same day.
What is a data pipeline in the context of an IoT dashboard?
An IoT data pipeline is the sequence of steps data takes from its source to the screen. It typically starts at the sensor, is transmitted to an MQTT broker, may be processed or filtered by an intermediary service, and is finally consumed and displayed by a widget on a dashboard. Each step is crucial for ensuring data is timely, accurate, and in the correct format.
Why is data parsing (like JSONPath) important for visualization?
Data parsing is vital because IoT devices often send data in structured formats like JSON, containing multiple values in a single message. A feature like JSONPath allows a widget to precisely extract only the single piece of information it needs (e.g., the 'temperature' value from a larger payload) to display it correctly, making the system highly efficient and flexible.
What's the difference between real-time and historical data visualization?
Real-time visualization shows the most current state of a device or sensor (e.g., a gauge showing current pressure). Historical visualization shows data over a period of time (e.g., a line chart showing pressure trends over the last week). Both are critical: real-time for immediate operational awareness and historical for trend analysis, reporting, and predictive maintenance.